The Top Zip Codes for Investment Properties in Your Area [2021 1st Quarter]
A new year, a new quarter! In 2021’s first quarter, thousands of investment properties were added to MyHouseDeals throughout the US. This report provides data about which market areas and deal types are available for profitable investing.
In 2020, a new investment property deal type called motivated MLS was added to MyHouseDeals.com. Motivated MLS deals are houses for sale on the multiple listing service (MLS) that are best suited for real estate investors. These houses are handpicked for MyHouseDeals due to their profit and negotiation potential.
Below we break out the four different deal types on our website: wholesale deals, investor-ready foreclosures, motivated seller deals, and motivated MLS deals. You’ll see graphs showing the percentage of each deal type along with which states and cities contain the most investment properties.
Then, we list the cities and zip codes with the greatest number of deals, followed by the average ARV for each state. Check out the maps to see which areas are hot right now for bargain properties. To view the summarized report containing the top 5 zip codes for each market area, go here.
If you do your own marketing to find potential investment properties, target properties in these zip codes since they are more likely to have motivated sellers and/or properties needing repair. Both of these conditions can lead to greater discounts and profits for investors like you.
Keep reading for these breakdowns of hot investment areas so you can see how the rest of 2021 might pan out!

The Big Picture:
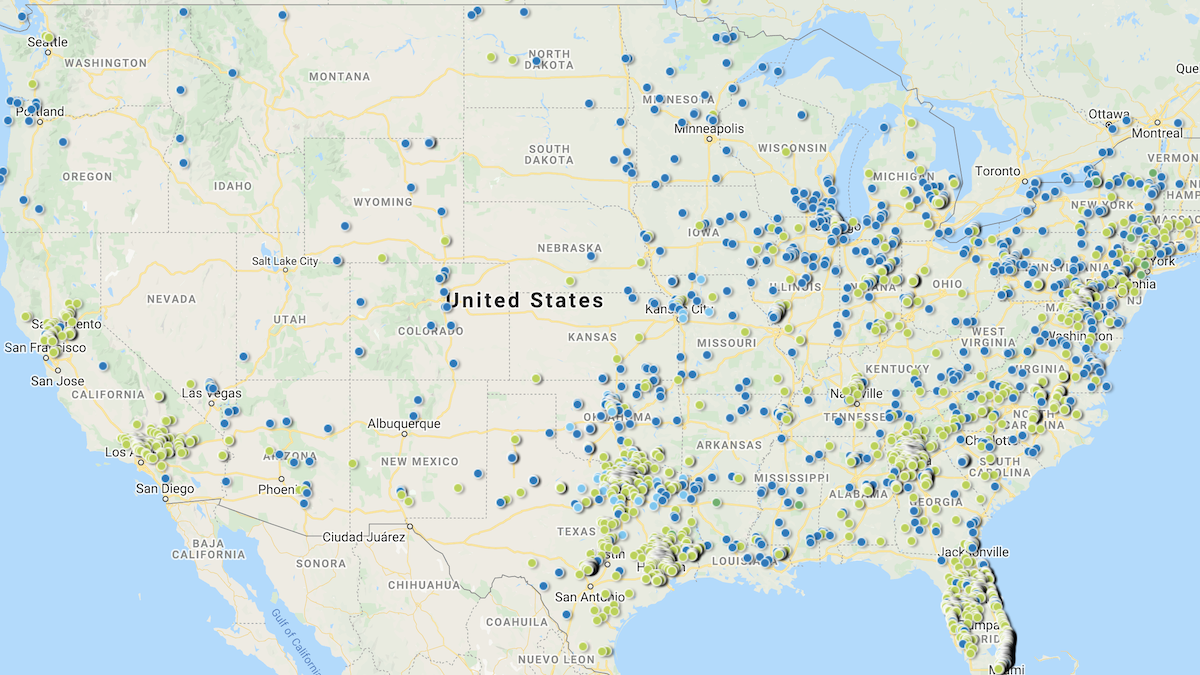
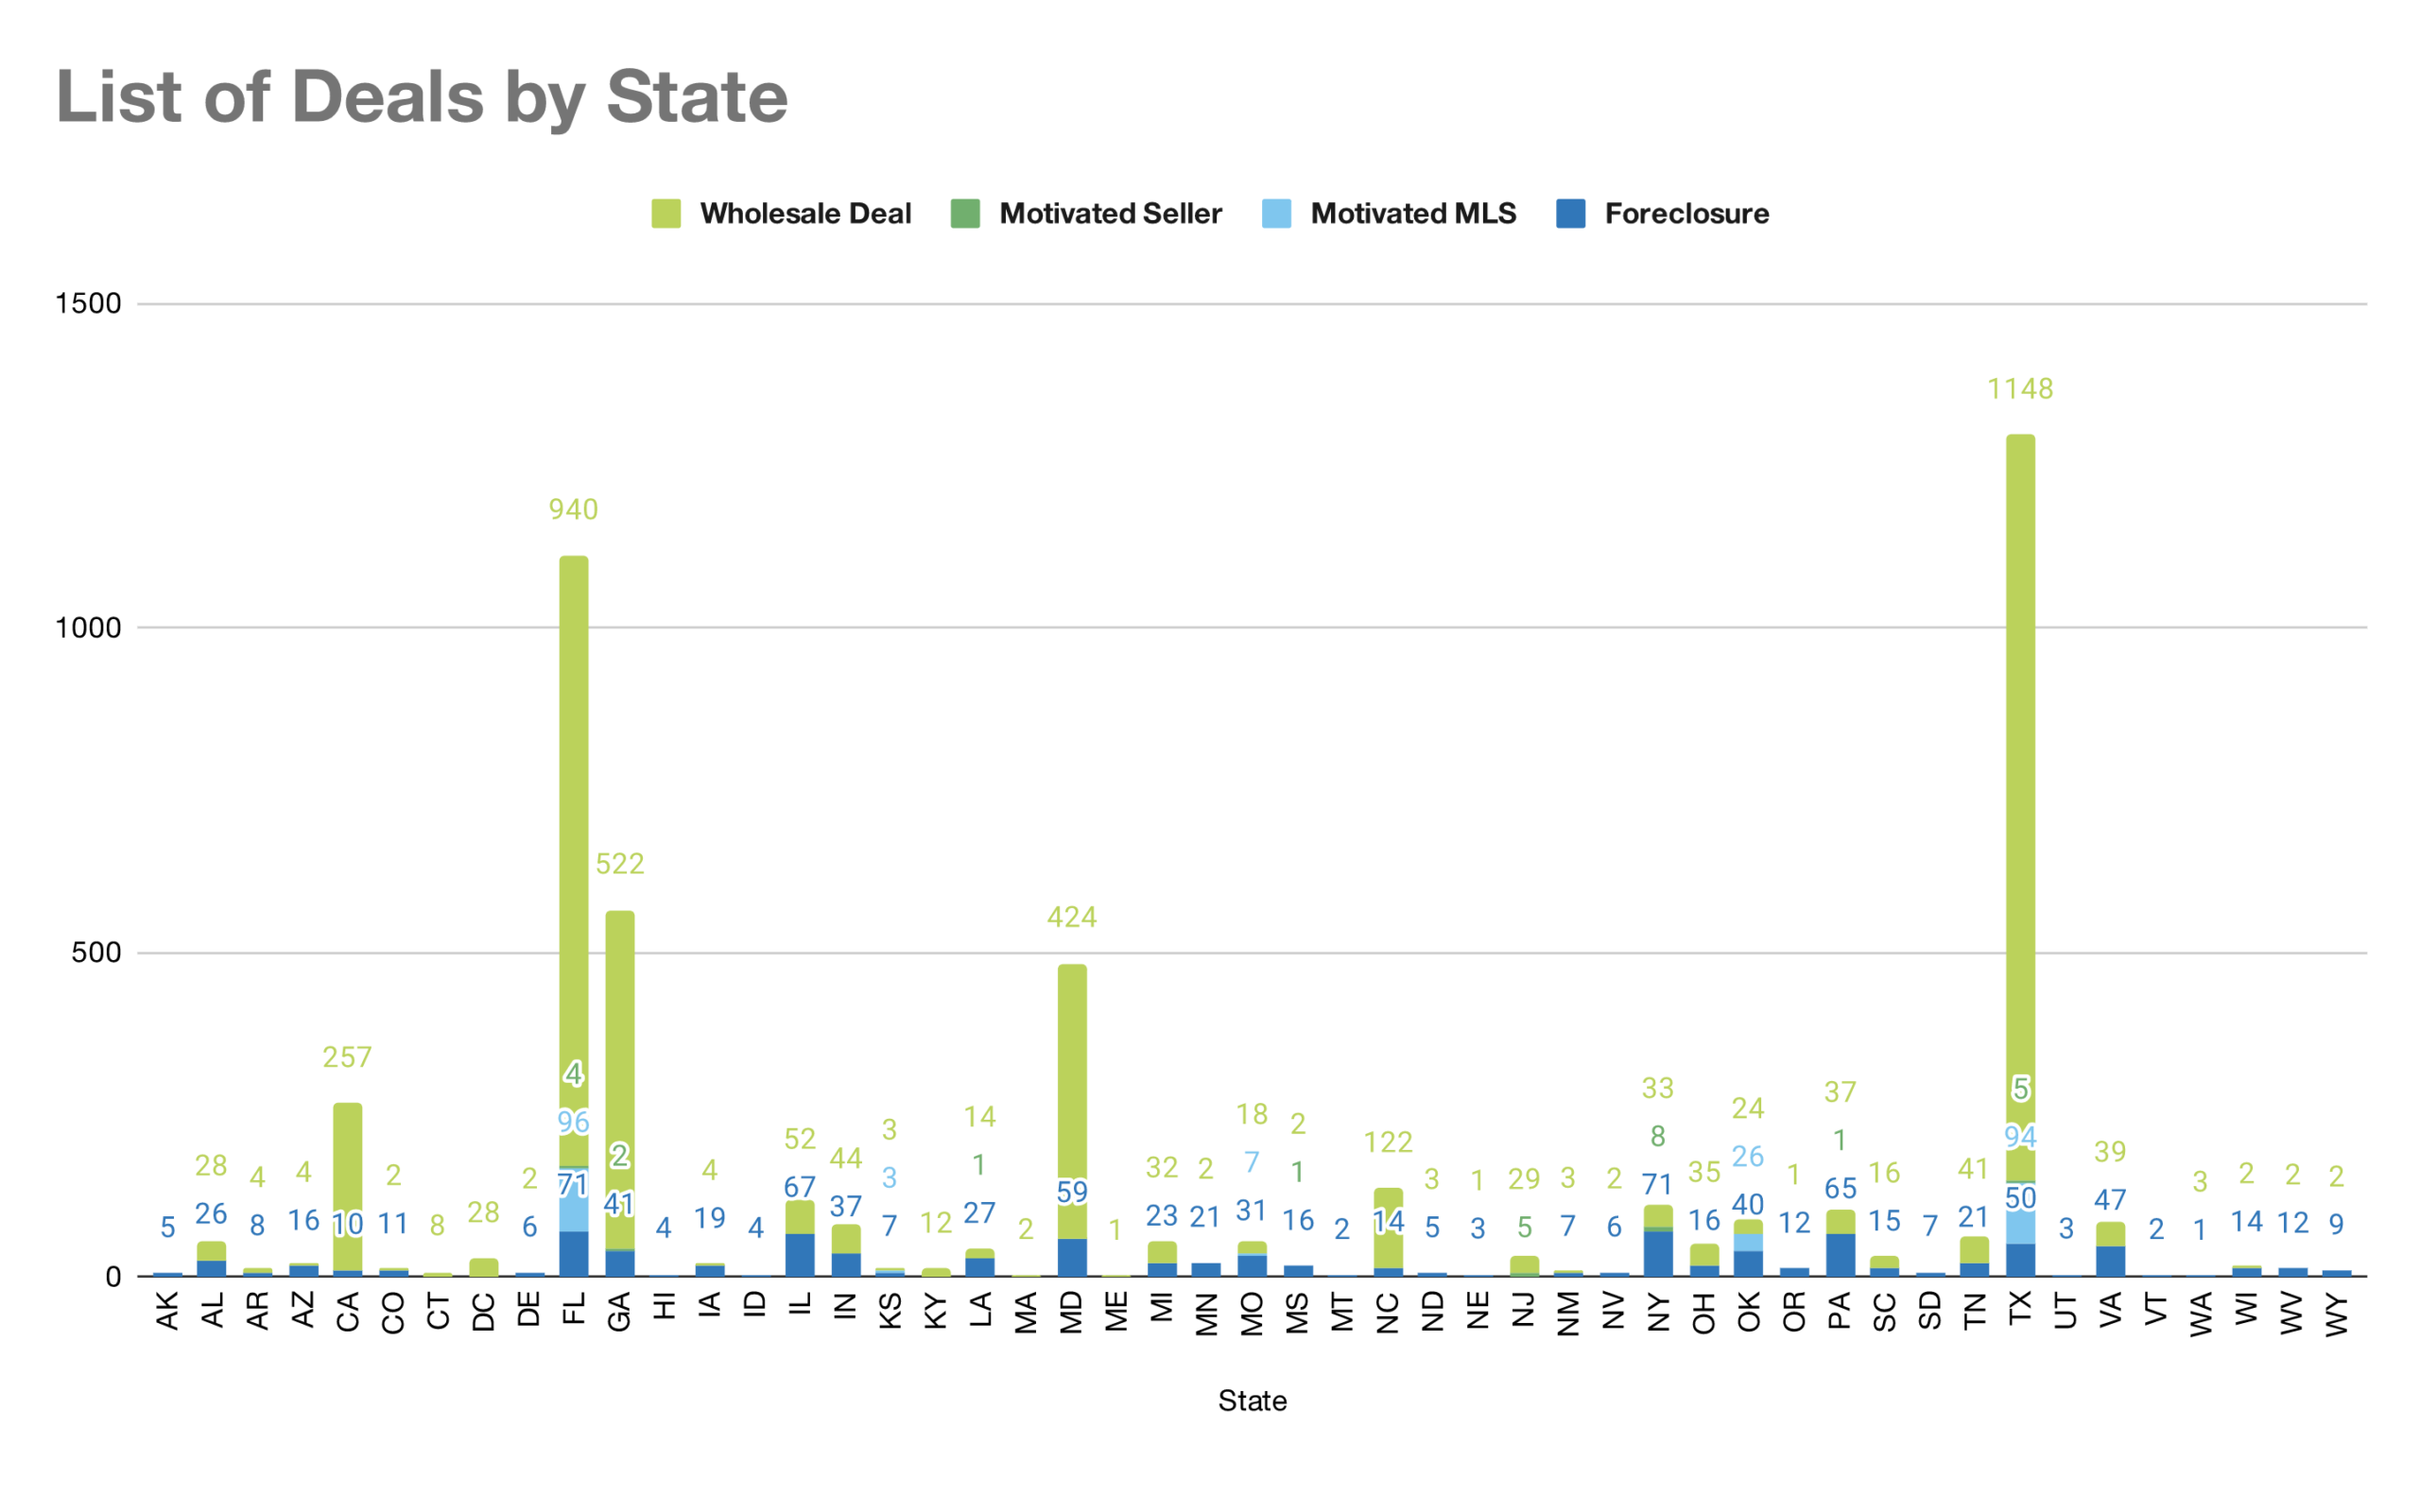
There are too many markets to list, so here is a breakdown of where these deals can be found by state (click to expand).
Here is a percentage breakdown of the types of properties added to the site during the first quarter of 2021 (click to expand).
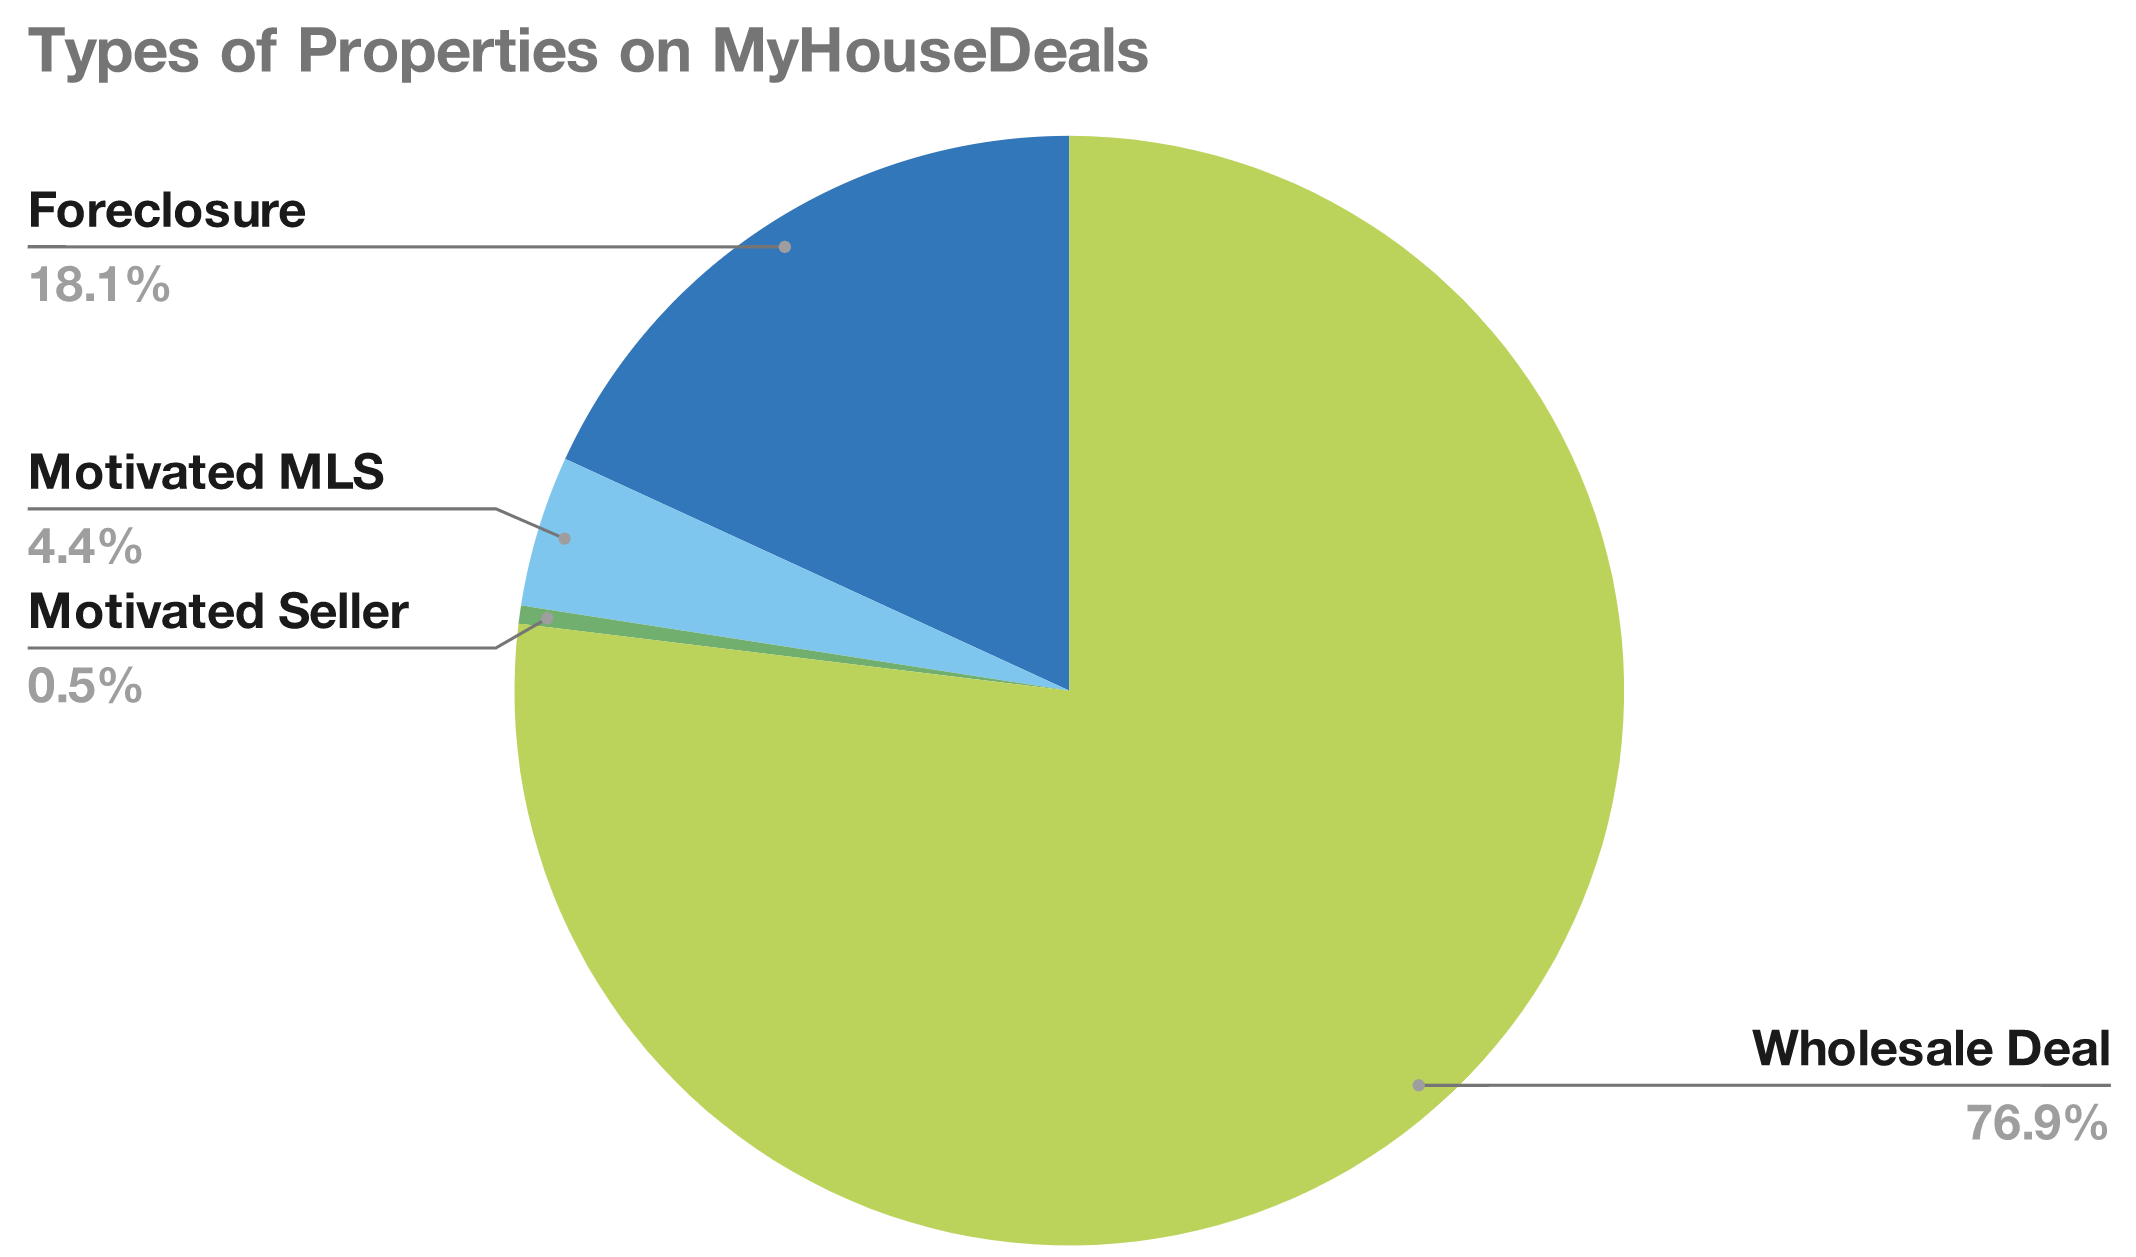
With foreclosure moratoriums instituted in response to the COVID-19 pandemic, wholesale deals continue to make up most of the deals made on MyHouseDeals, a trend we saw in 2020’s fourth quarter.
If you want to view a specific type of property deal, select only the property types you want to see in your search parameters (click to expand).

The top 5 market areas for investment property deals include:
- South Florida
- Dallas/Forth Worth
- Washington D.C.
- Atlanta
- Houston
Here is the exact number of deals per market area:
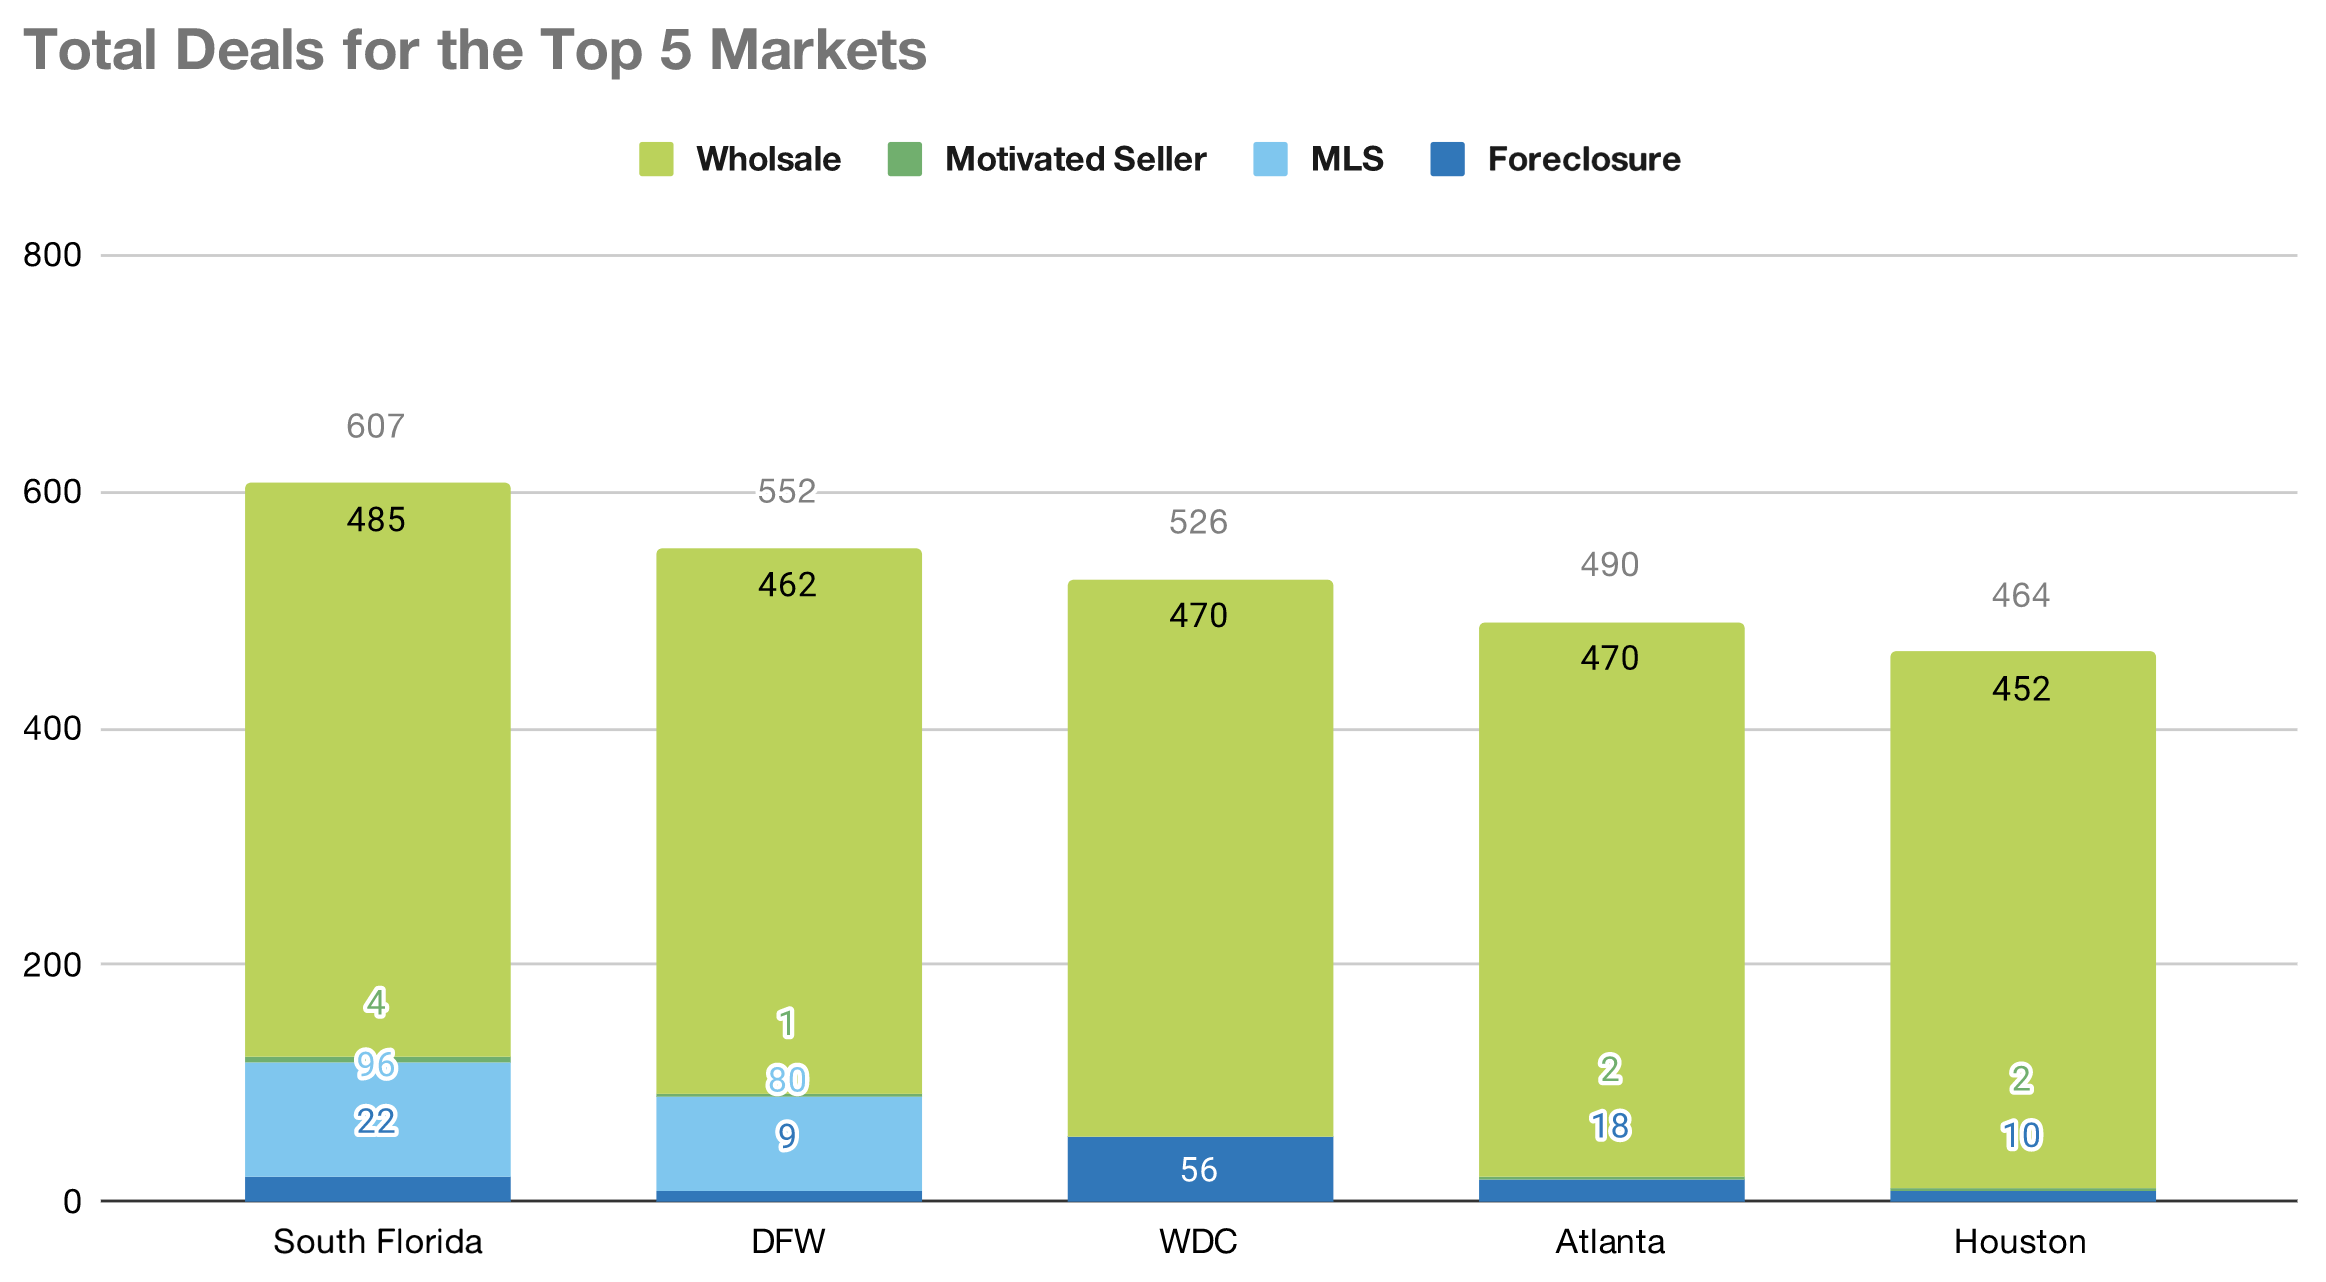
Deal Activity per Market Area:
These maps are a little more interesting! You can see the hot areas (and the not so hot areas) for investment properties in each city. These are our top 20 markets (in order from the greatest amount of deals to least)!
Looking for a specific market? Click on the links below to jump directly to your area.
Indianapolis
Pittsburgh
Jacksonville & Brunswick
Beaumont & Port Arthur
Detroit
Hampton Roads
#1 South Florida
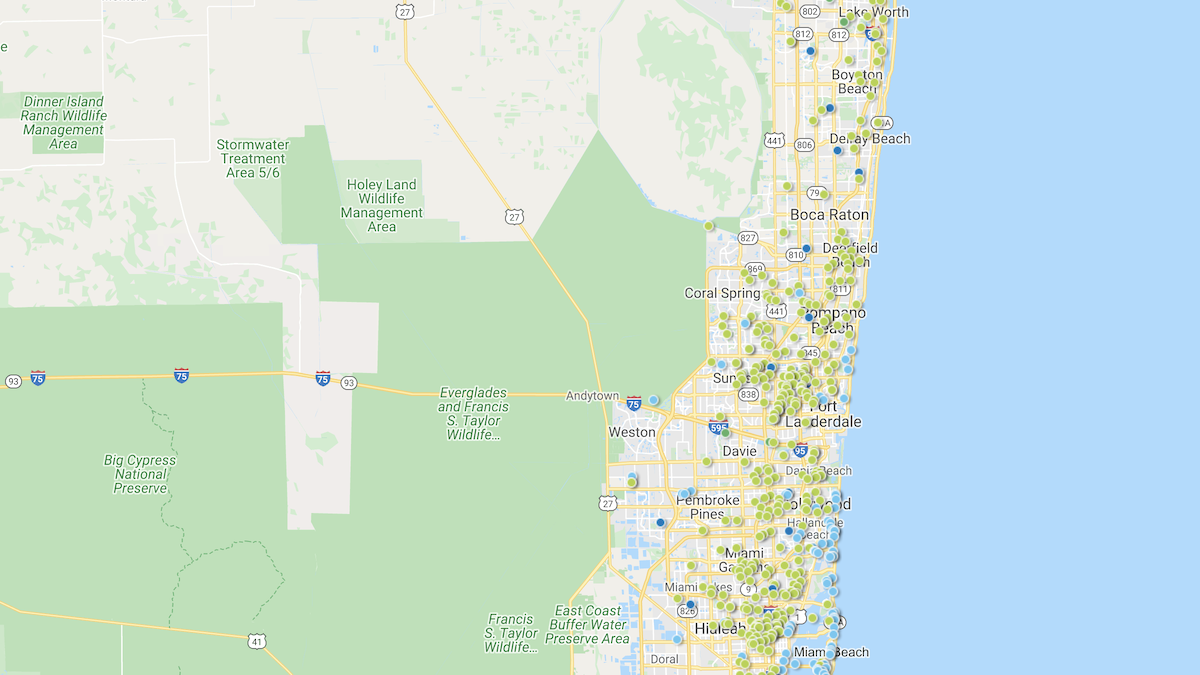
Top 5 Zip Codes for Deals in the South Florida Area:
33311
33407
33404
33313
33161
33487
33472
33976
33909
33484
33463
33462
33314
33328
33160
33139
33140
33156
33141
#2 Dallas/Fort-Worth
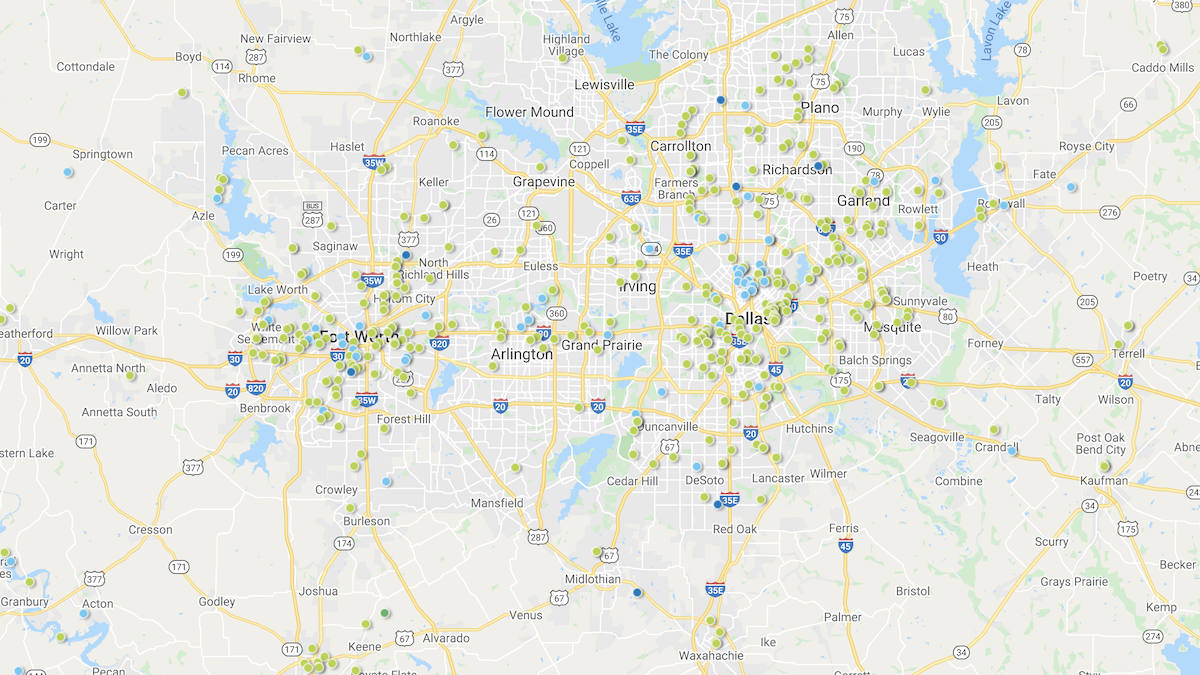
Top 5 Zip Codes for Deals in Dallas/Fort-Worth, TX:
75215
75228
76116
75149
76107
76065
76457
75230
75154
75042
76009
75204
76110
76107
76011
75219
#3 Washington, D.C.
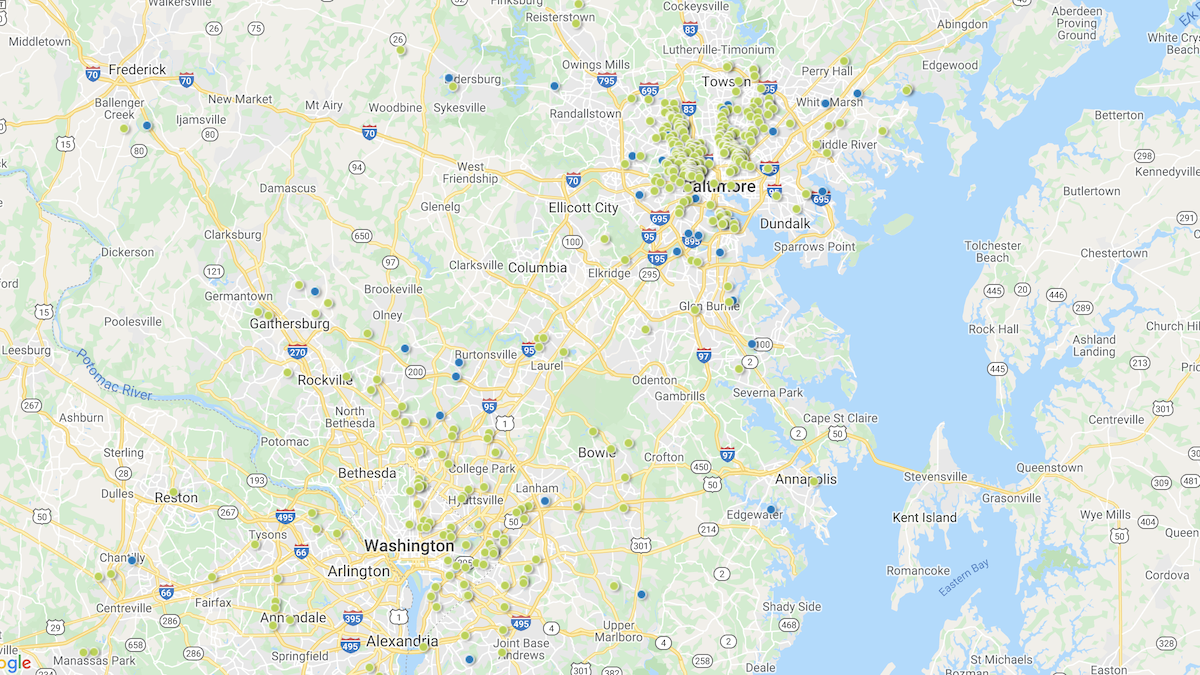
Top 5 Zip Codes for Deals in Washington, D.C.:
21223
21218
21215
21213
21216
21742
21225
22191
21216
21090
#4 Atlanta
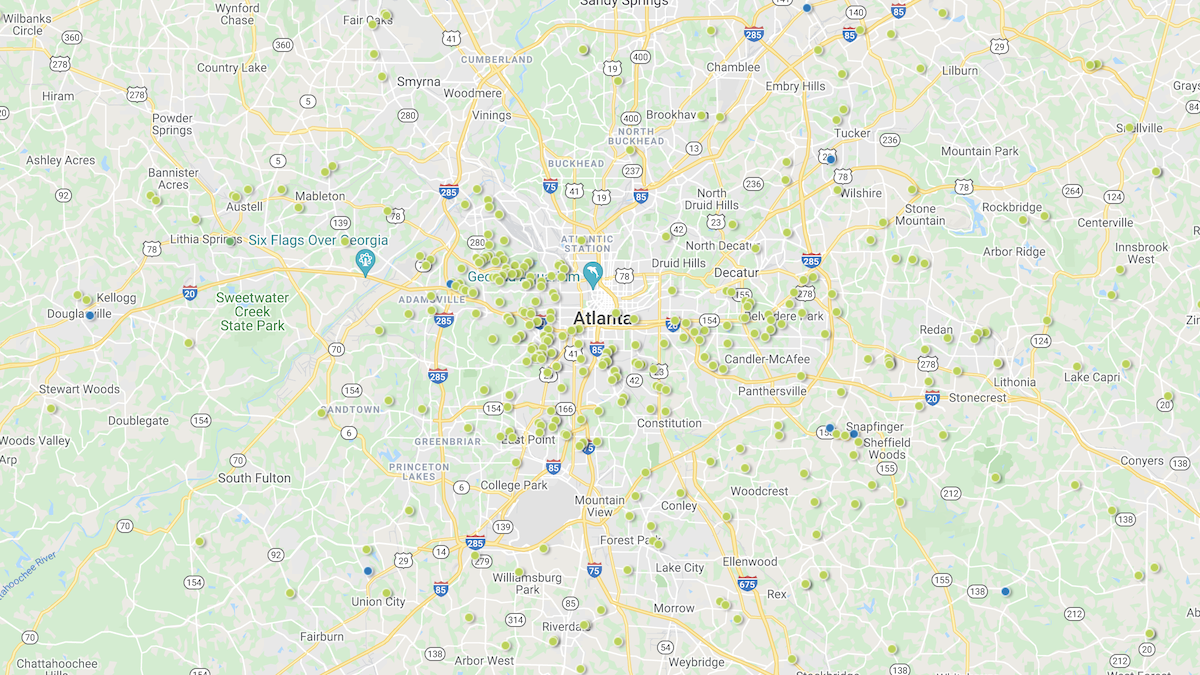
Top 5 Zip Codes for Deals in Atlanta, GA:
30310
30314
30318
30315
30032
30240
30034
30340
30315
30311
30108
30122
#5 Houston
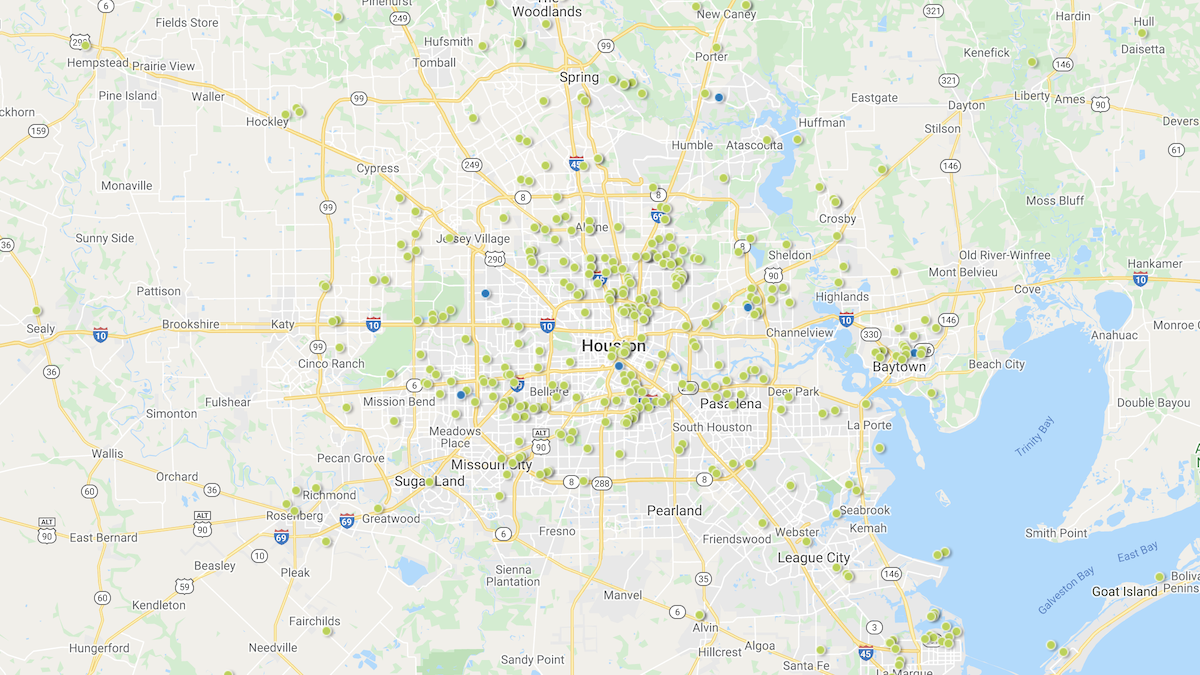
Top 5 Zip Codes for Deals in Houston, TX:
77028
77520
77016
77026
77590
77356
77099
77015
77080
77004
77356
77351
#6 Orlando-Daytona Beach – Melbourne
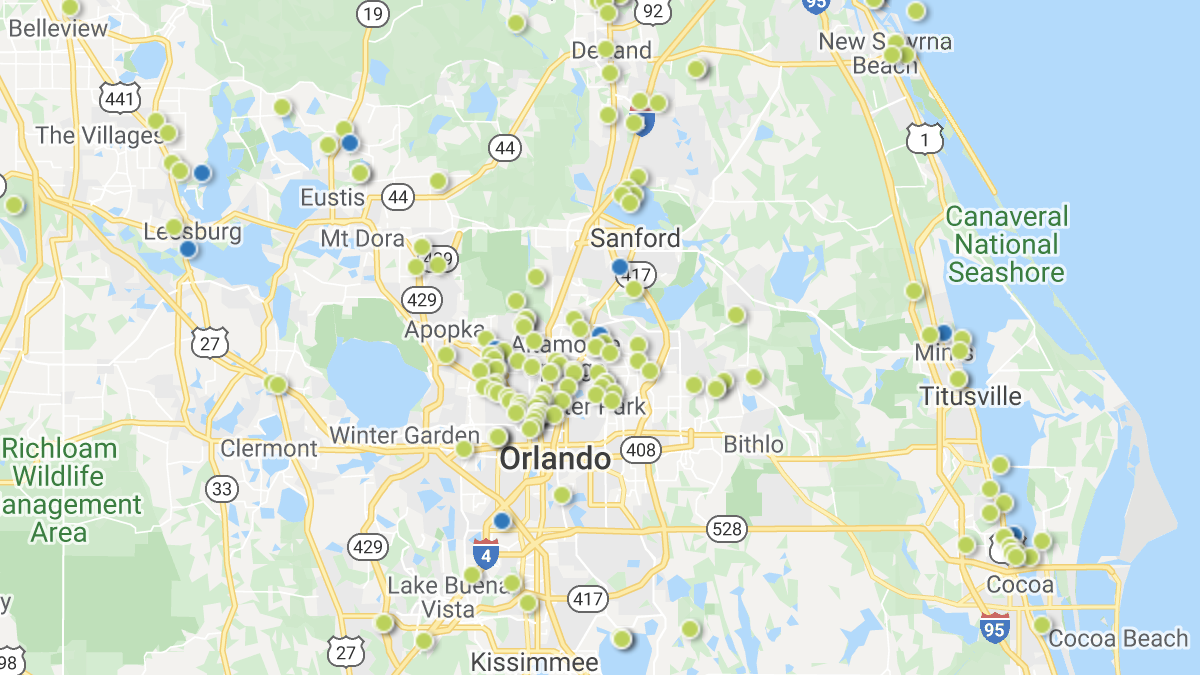
Top 5 Zip Codes for Deals in Orlando-Daytona Beach-Melbourne, FL:
32805
32720
32808
32811
32905
34748
32935
32922
32909
32905
#7 Tampa Bay
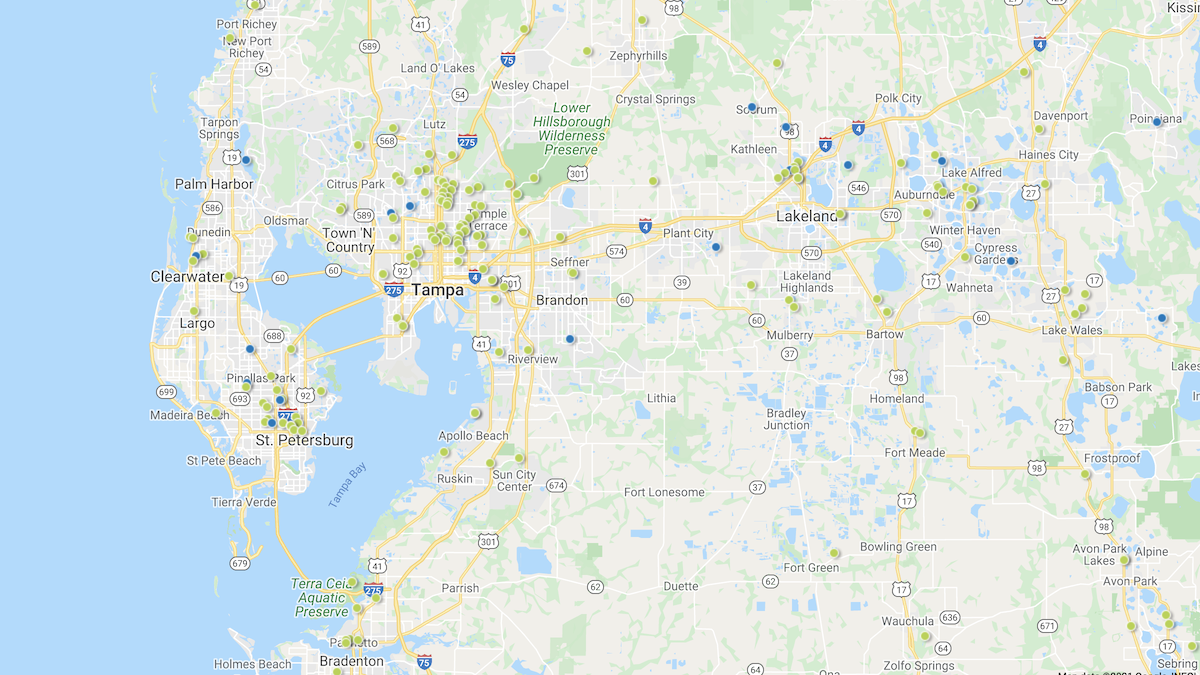
Top 5 Zip Codes for Deals in Tampa, FL:
33619
33610
33612
33605
33604
33810
33614
34759
34684
34452
#8 Los Angeles
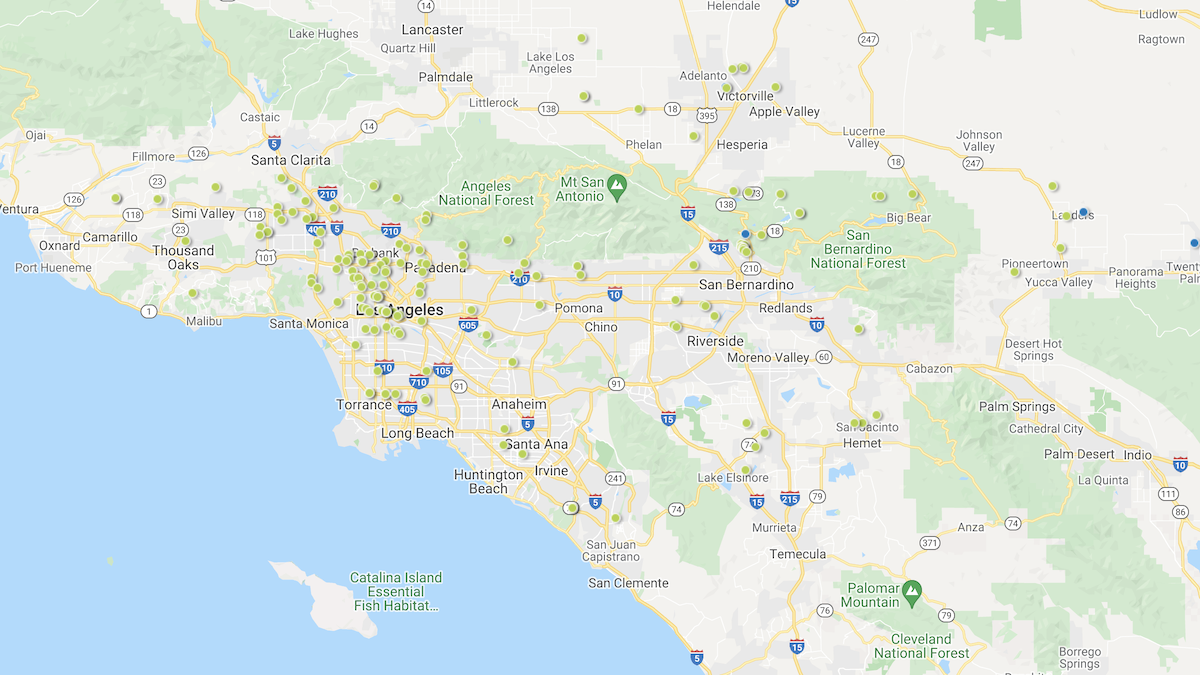
Top 5 Zip Codes for Deals in Los Angeles, CA:
90003
92405
92225
90044
90019
92277
92284
92405
92392
#9 Central Texas
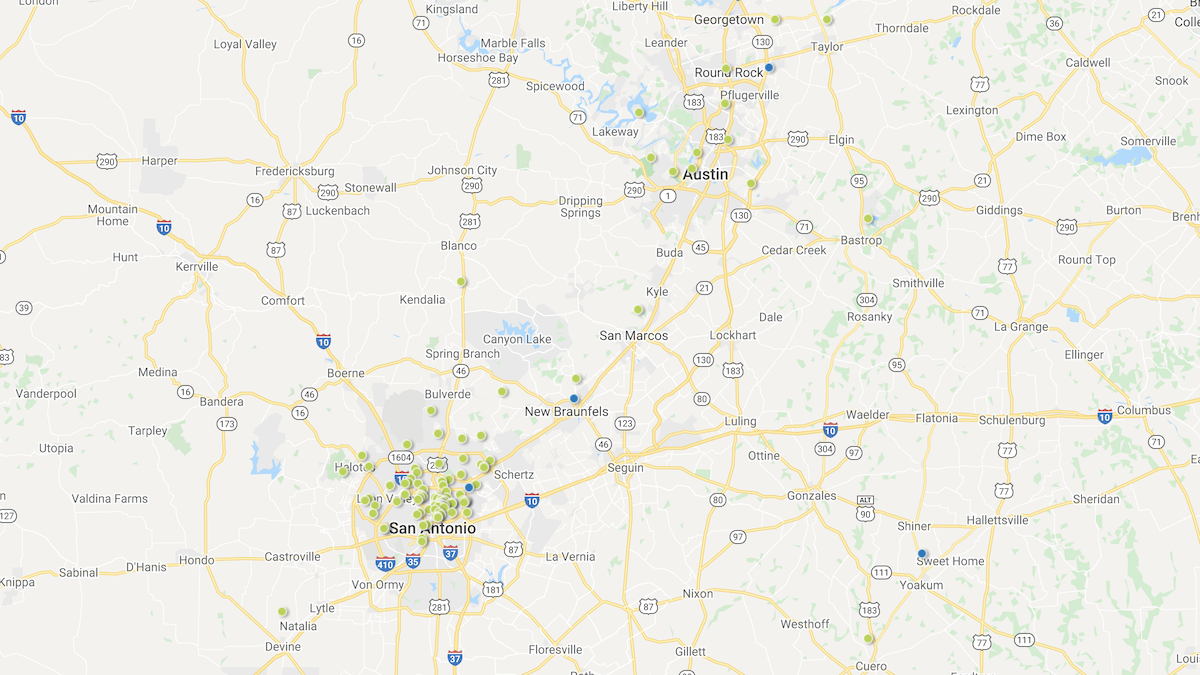
Top 5 Zip Codes for Deals in Central Texas:
78210
78202
78220
78203
78207
78801
78660
78852
77995
78130
76548
76567
76691
#10 Raleigh-Durham
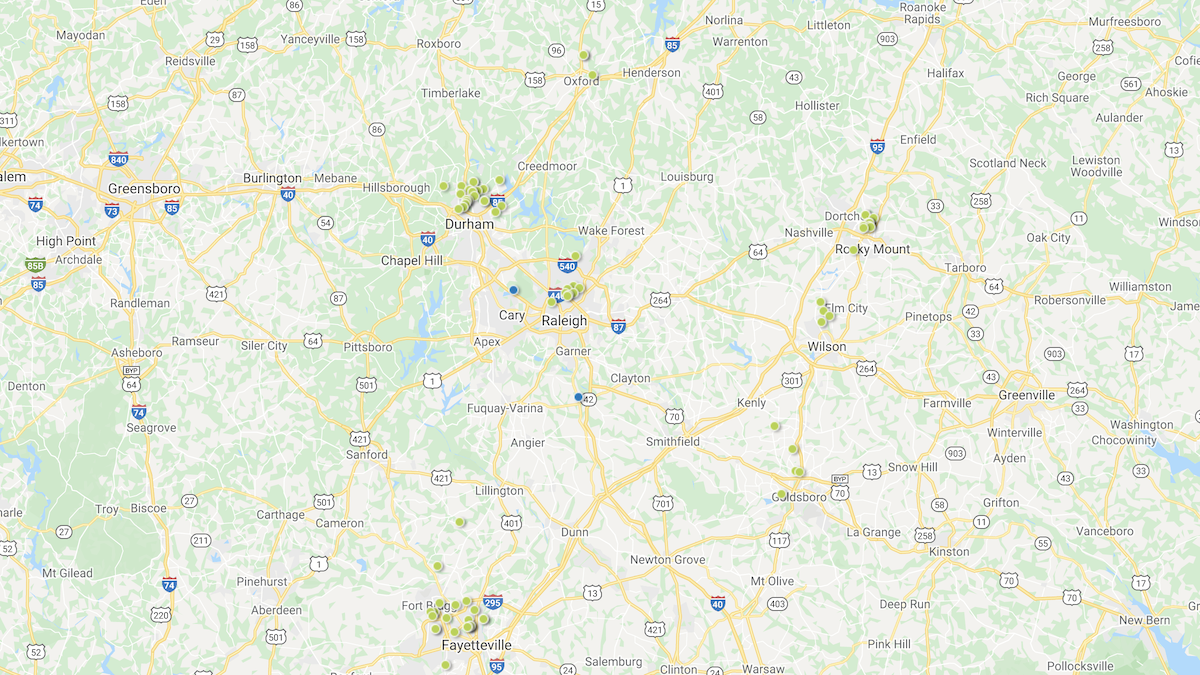
Top 5 Zip Codes for Deals in Raleigh-Durham, NC:
27870
27801
28306
27707
27703
27592
27511
#11 NYC/Tri-State Area
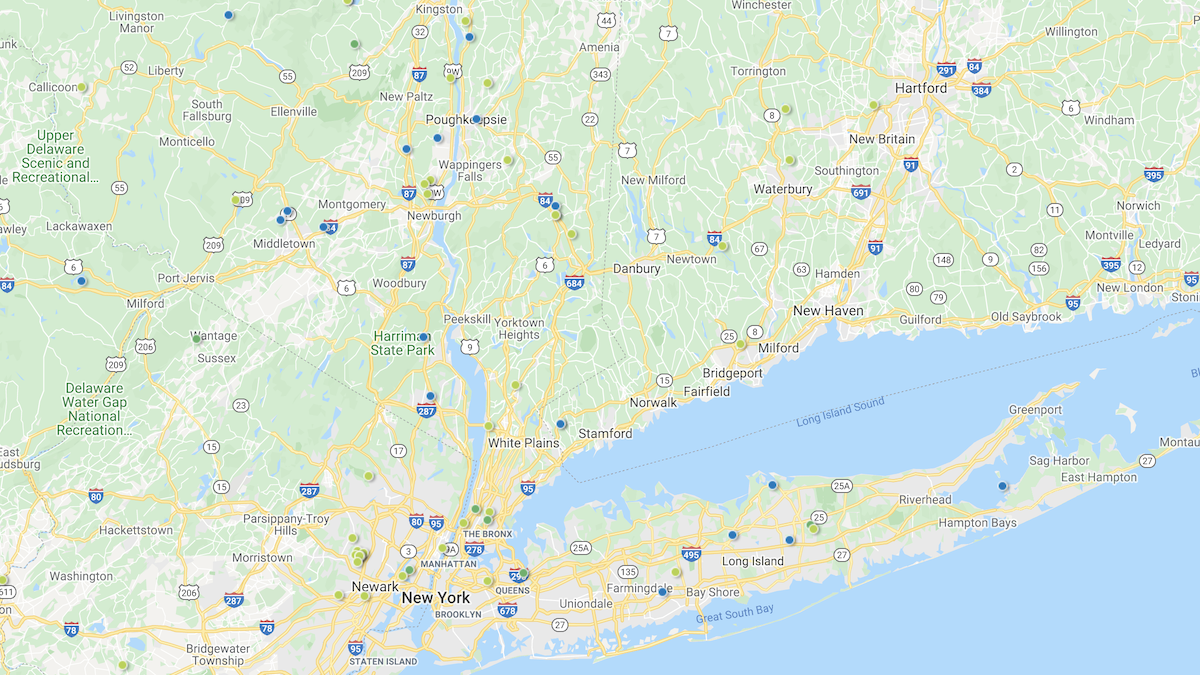
Top 5 Zip Codes for Deals in the NYC/Tri-State Area:
12550
12461
8865
7111
12726
10940
18337
12740
12603
12542
10473
10460
8902
8755
7724
#12 Chicago
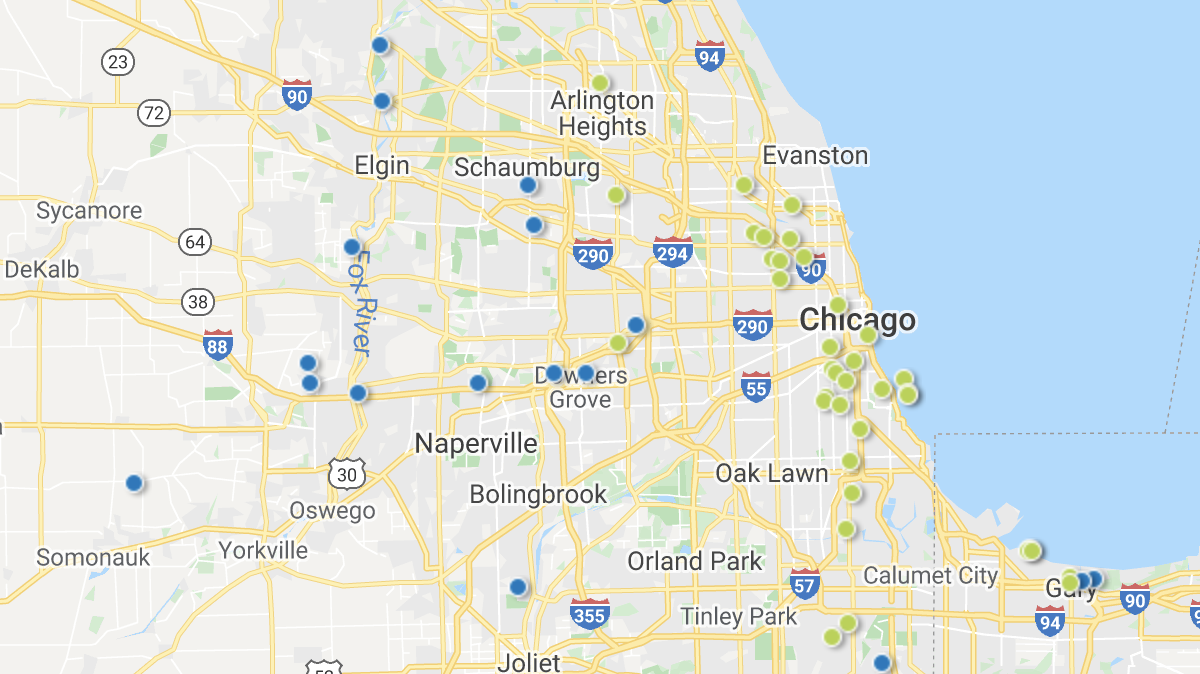
Top 5 Zip Codes for Deals in Chicago, IL:
60620
60651
60636
60617
46404
60417
60506
60964
60914
60901
#13 Oklahoma Market
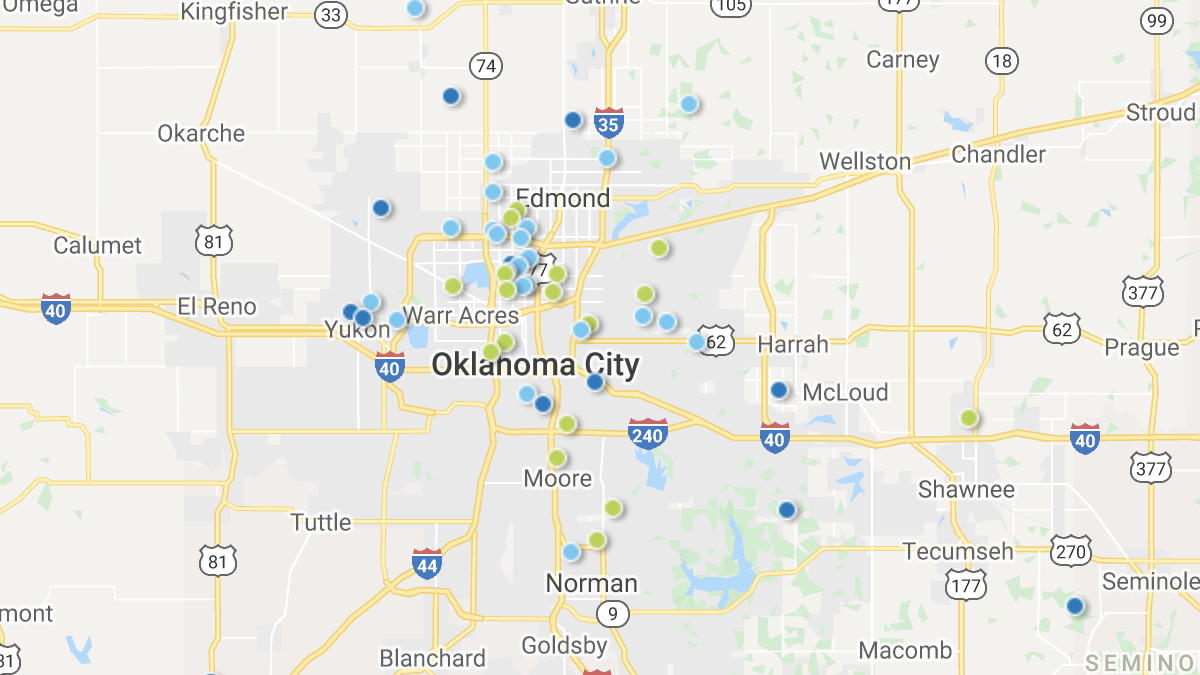
Top 5 Zip Codes for Deals in the Oklahoma Market Area:
73160
73119
73071
74801
73130
73099
73701
73601
74857
74854
73118
73130
73120
73116
73099
#14 Philadelphia
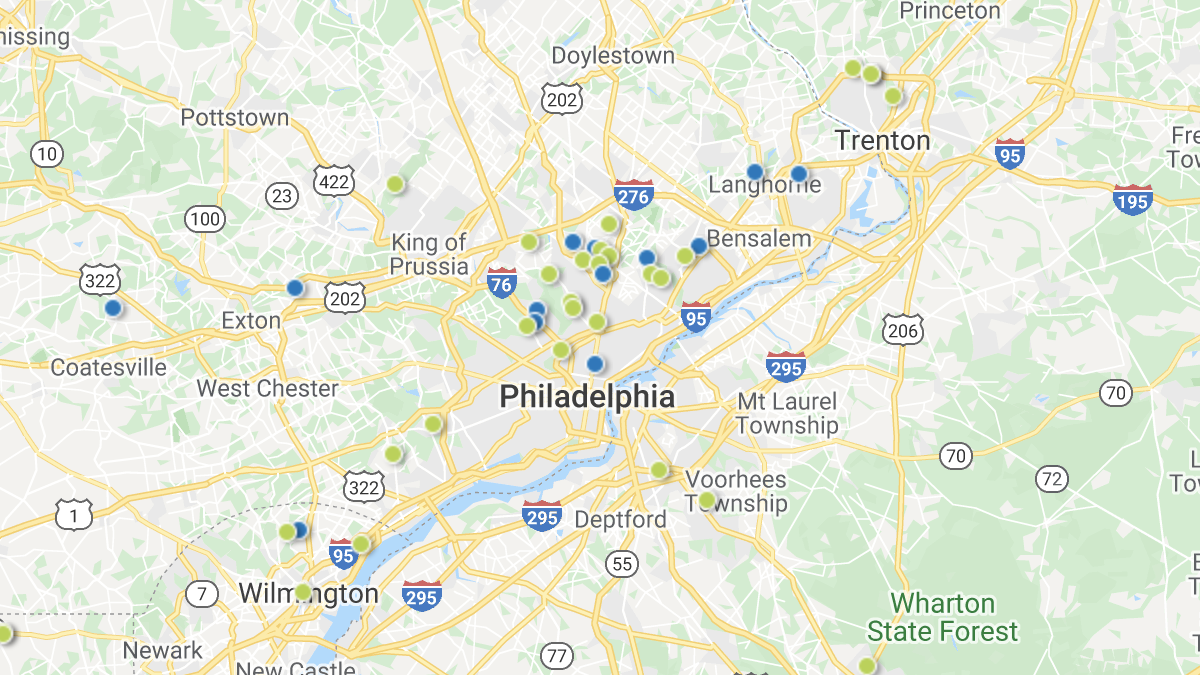
Top 5 Zip Codes for Deals in Philadelphia, PA:
8618
21901
19141
19121
8360
19131
18072
21903
21658
19962
#15 Indianapolis
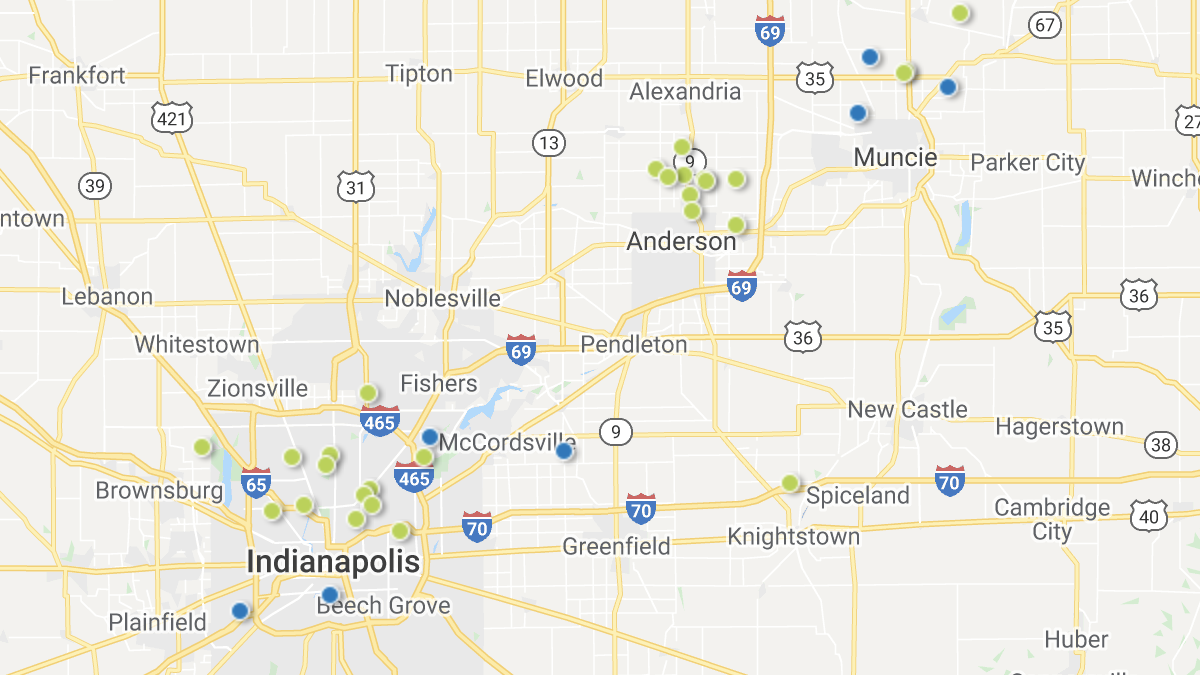
Top 5 Zip Codes for Deals in Indianapolis, IN:
46012
47303
46222
46208
46203
46902
47960
47448
47304
47303
#16 Pittsburgh
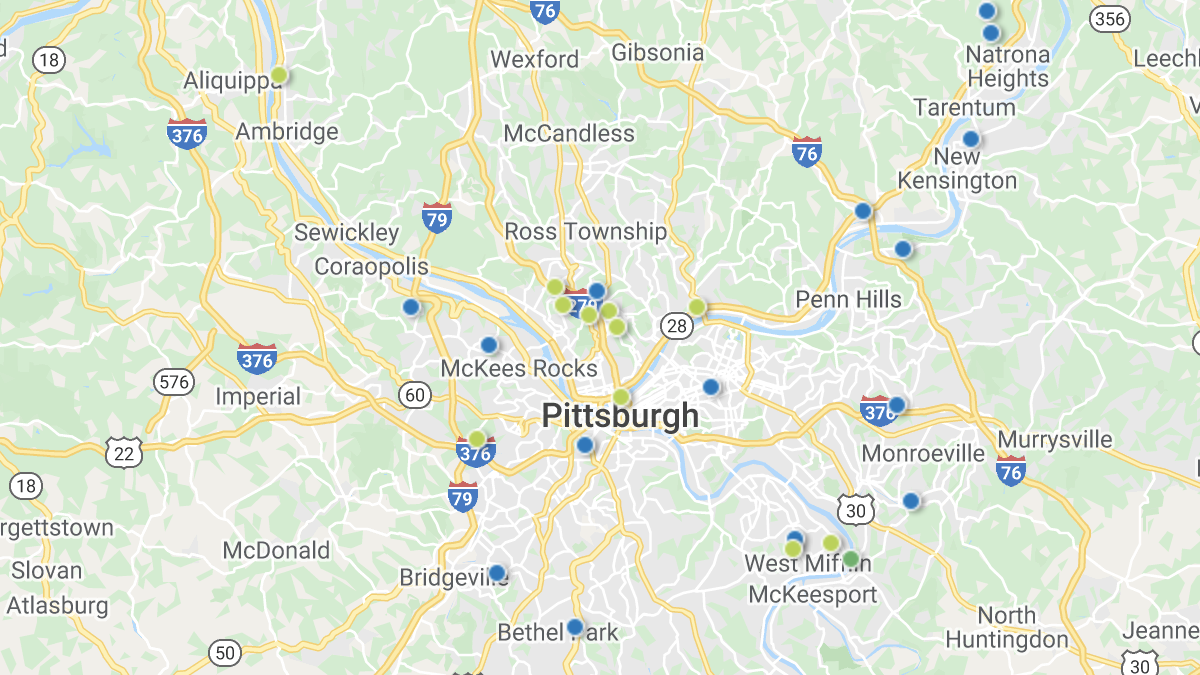
Top 5 Zip Codes for Deals in Pittsburgh, PA:
15212
15022
15224
15214
15210
16101
15074
21536
16301
16105
15132
#17 Jacksonville & Brunswick
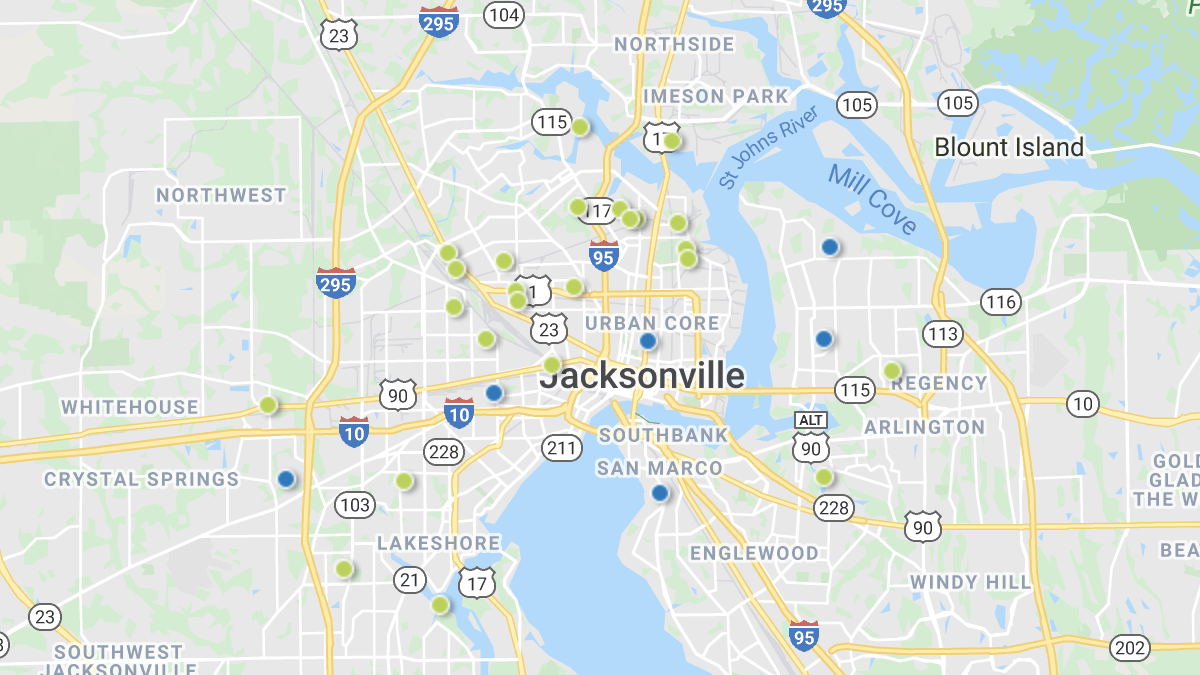
Top 5 Zip Codes for Deals in the Jacksonville & Brunswick Area, FL:
32206
32209
32254
32210
32208
31520
32277
32223
32211
32210
#18 Beaumont & Port Arthur
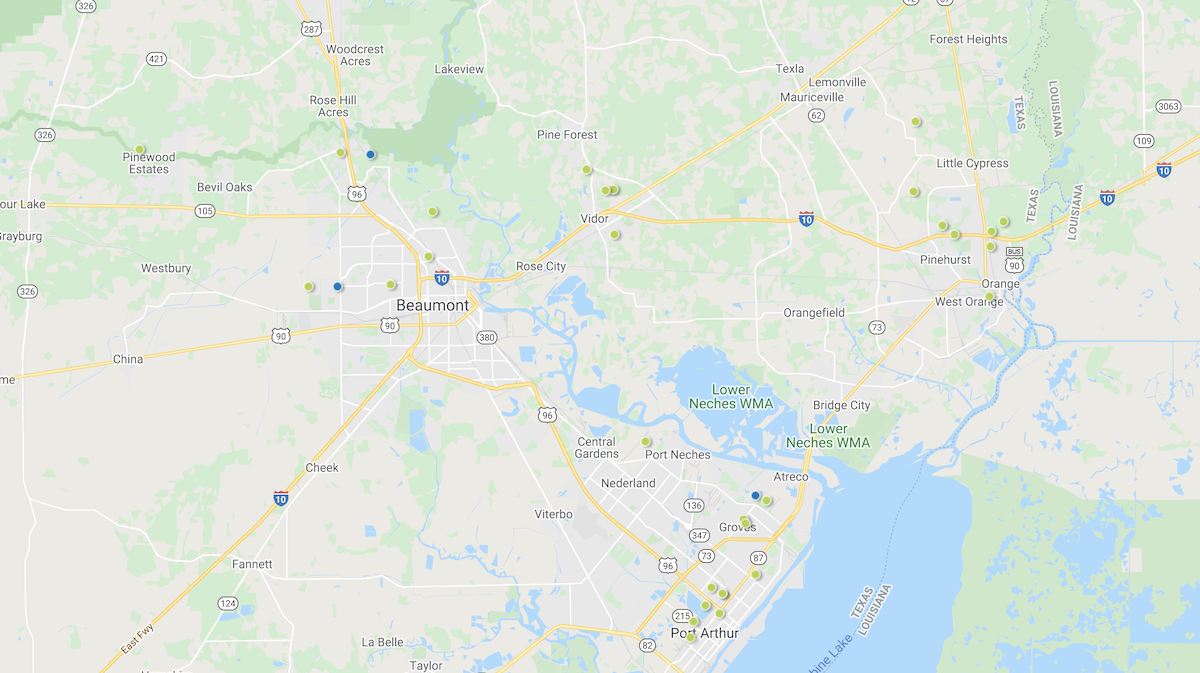
Top 5 Zip Codes for Deals in the Beaumont & Port Arthur Area, TX:
77640
77630
77662
77656
77619
77619
77708
77707
#19 Detroit
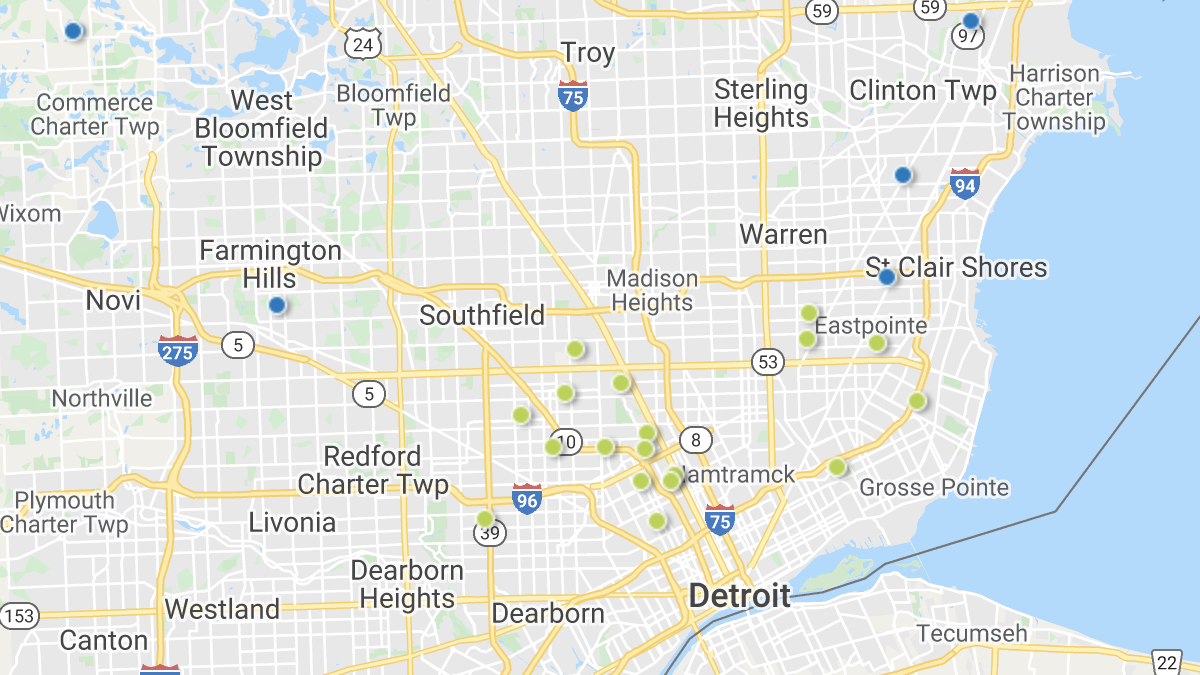
Top 5 Zip Codes for Deals in Detroit, MI:
48208
48206
48205
48238
48224
49270
48442
48382
48371
48336
#20 Hampton Roads
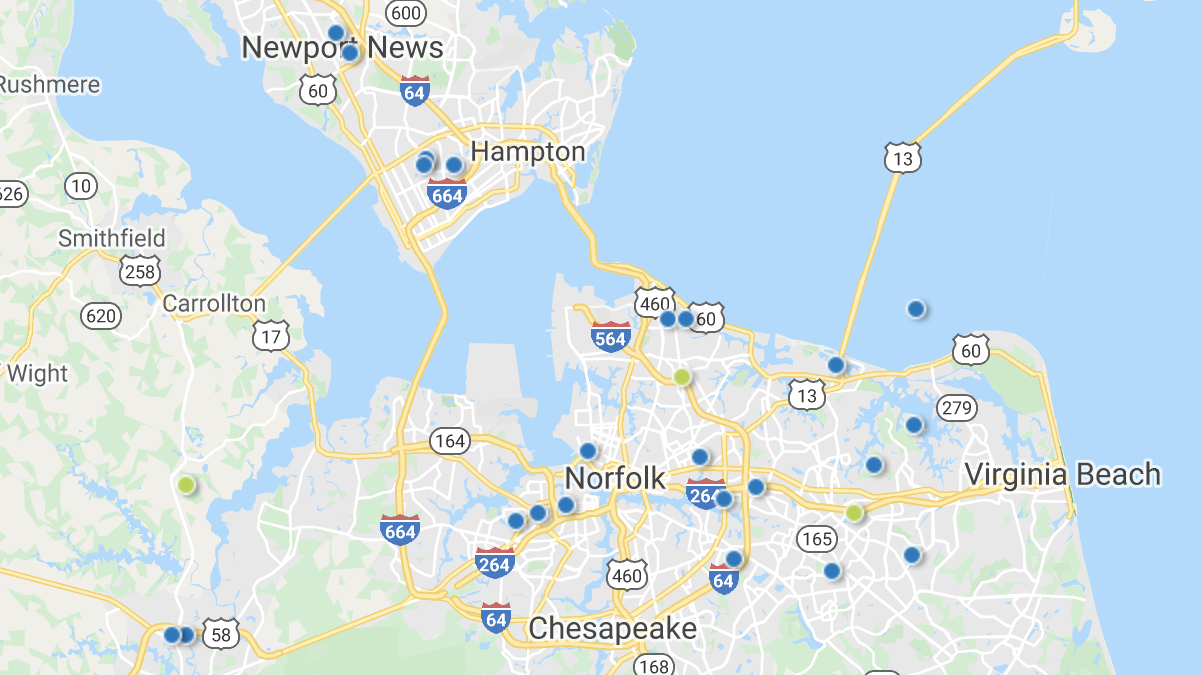
Top 5 Zip Codes for Deals in Hampton Roads, NY:
23513
23434
23350
27909
23453
23464
23702
23607
23601
23513
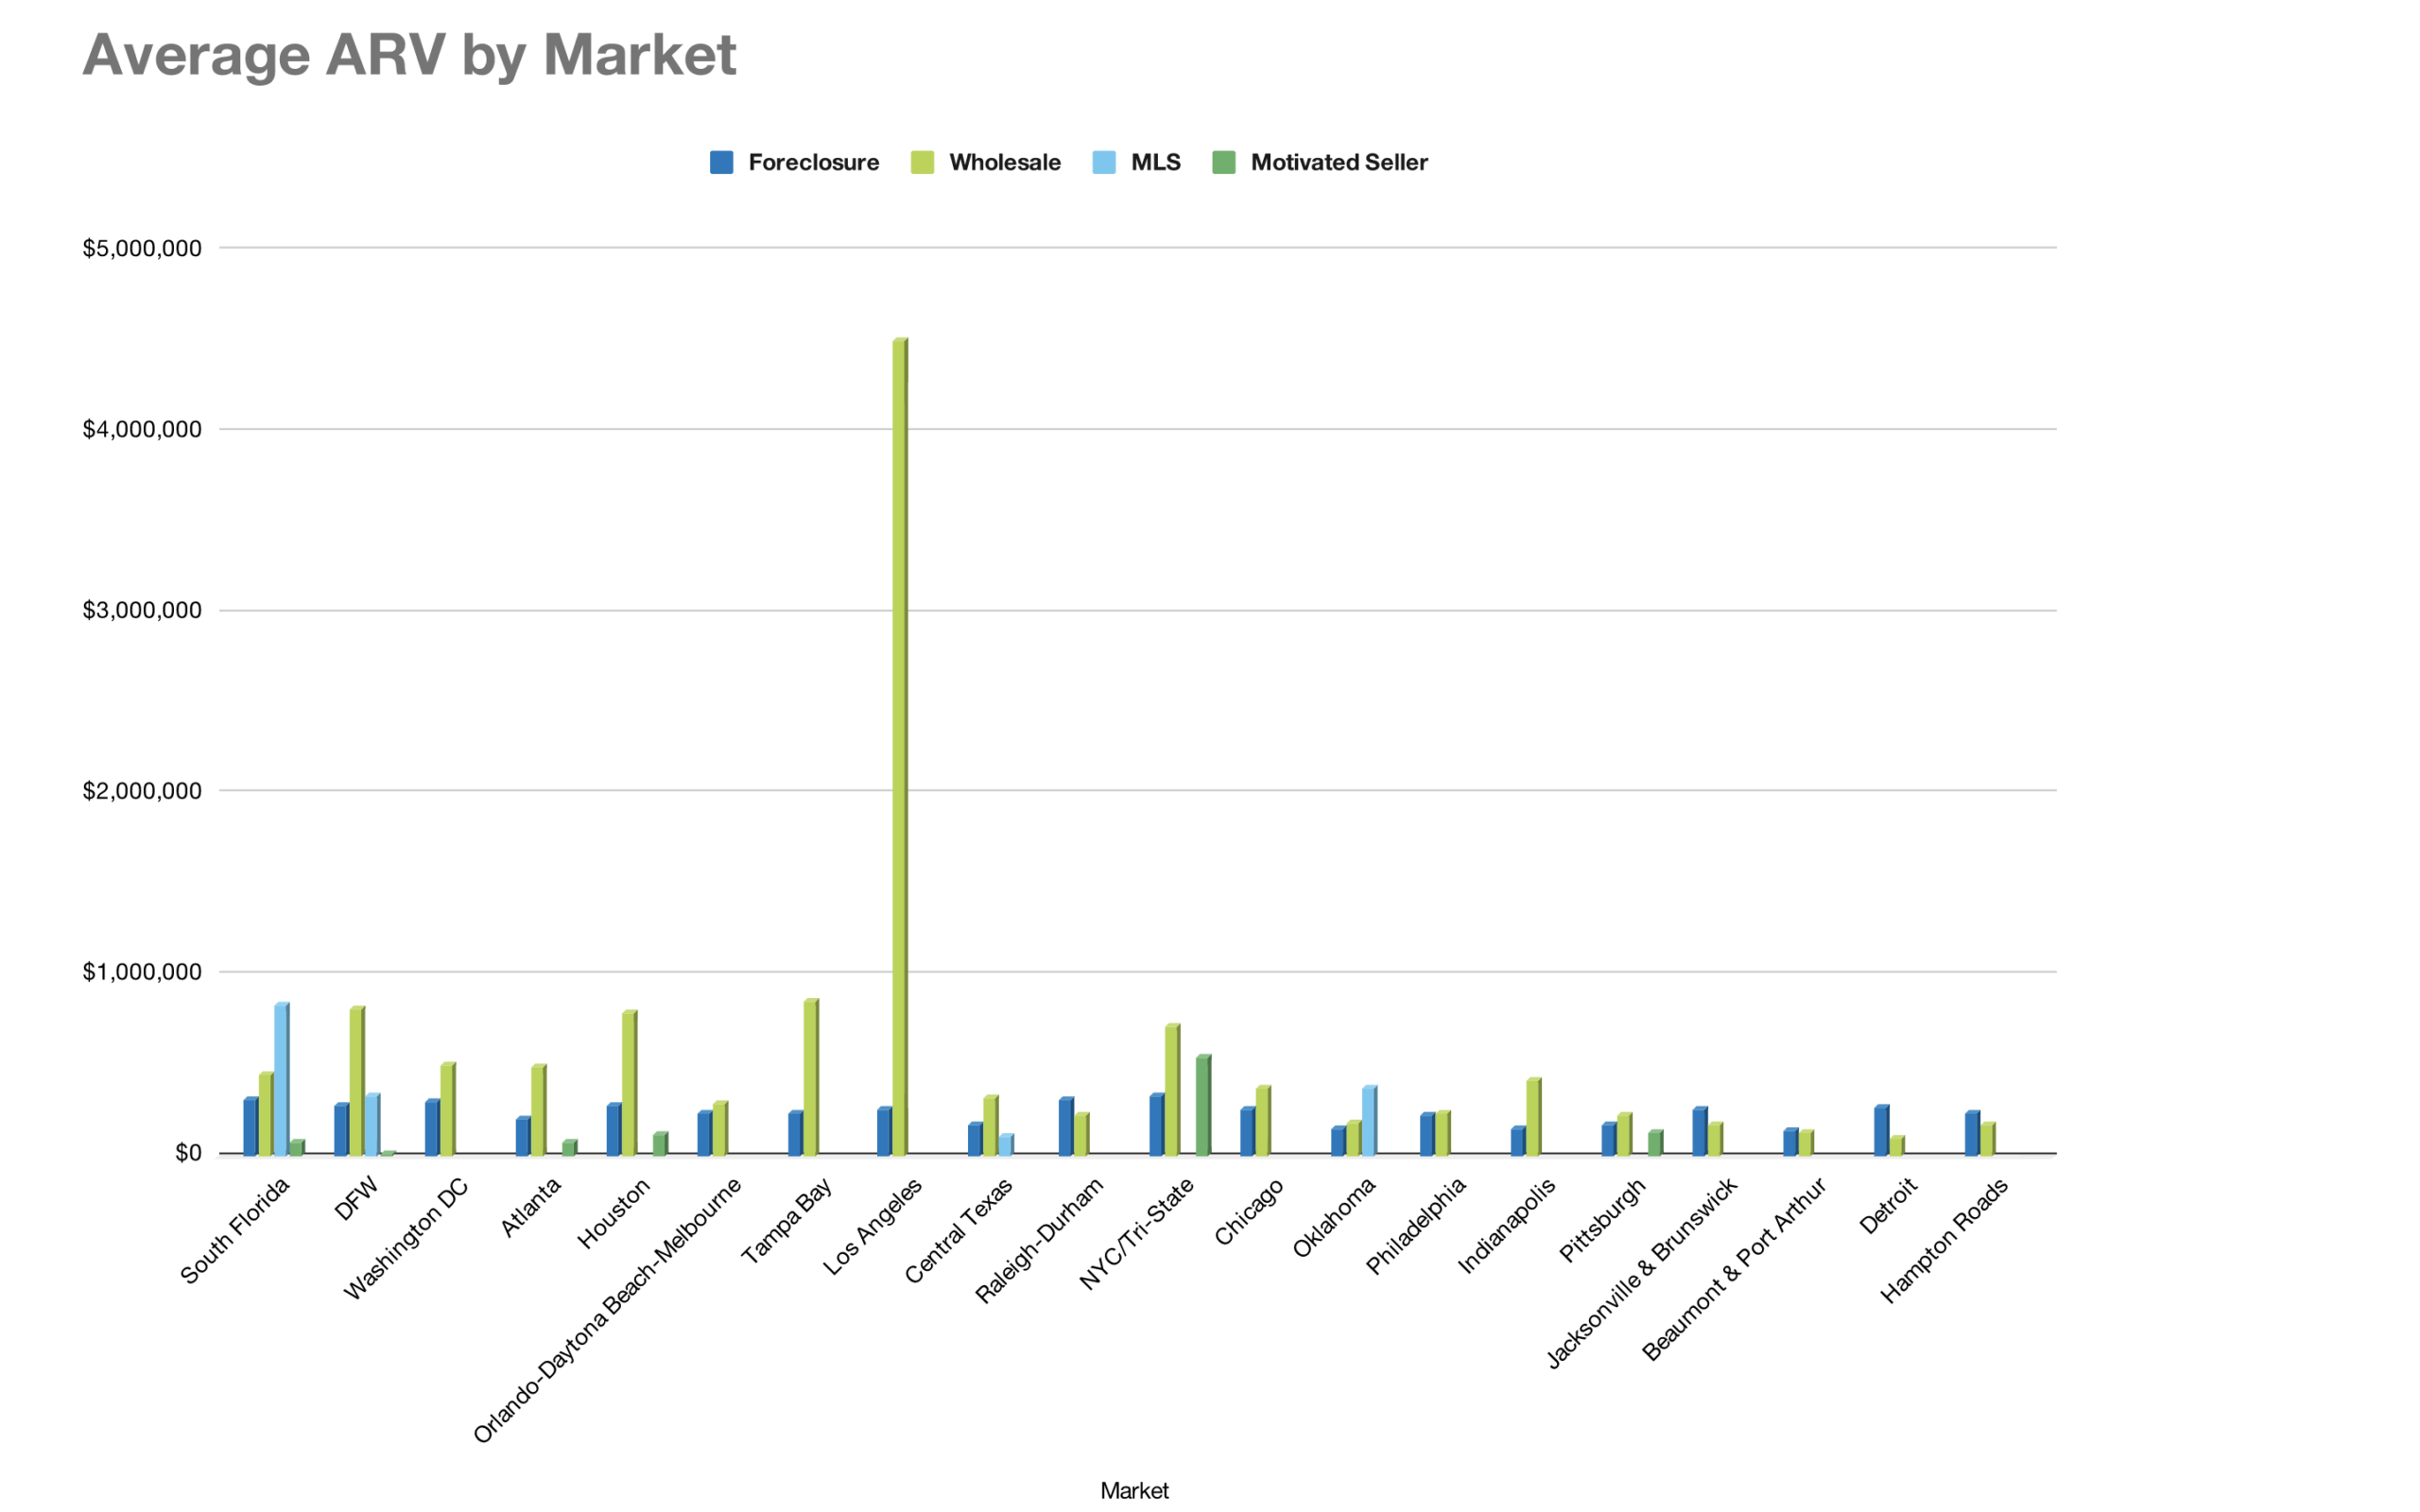
Average ARV per Market Area
Lastly, the average ARV for these 20 top market areas is summarized below (click to expand image):
Are you surprised by the zip codes on this list? Share your thoughts below . . .
To view a summarized report containing the top 5 zip codes for wholesale investment properties in each market area, visit this page.