The Top Zip Codes for Investment Property in Your Area [2018 1st Quarter]
The numbers are out! We are thrilled to release a list of the most popular zip codes for wholesale deals from January to March of 2018.
If you do your own marketing to find potential investment properties, target properties in these zip codes since they are more likely to have motivated sellers and/or properties needing repair. Both of these conditions can lead to greater discounts and profits for investors like you.
We have compiled this data from thousands of wholesale deals that were posted to our website this past quarter.
To view a summarized report containing the top 5 zip codes for each market area, visit this page.
Keep reading for the breakdown of hot investment areas and the zip codes where we saw the highest levels of deals activity during this past quarter.

The Big Picture:
Here is a percentage breakdown of the types of properties we currently have on the site.
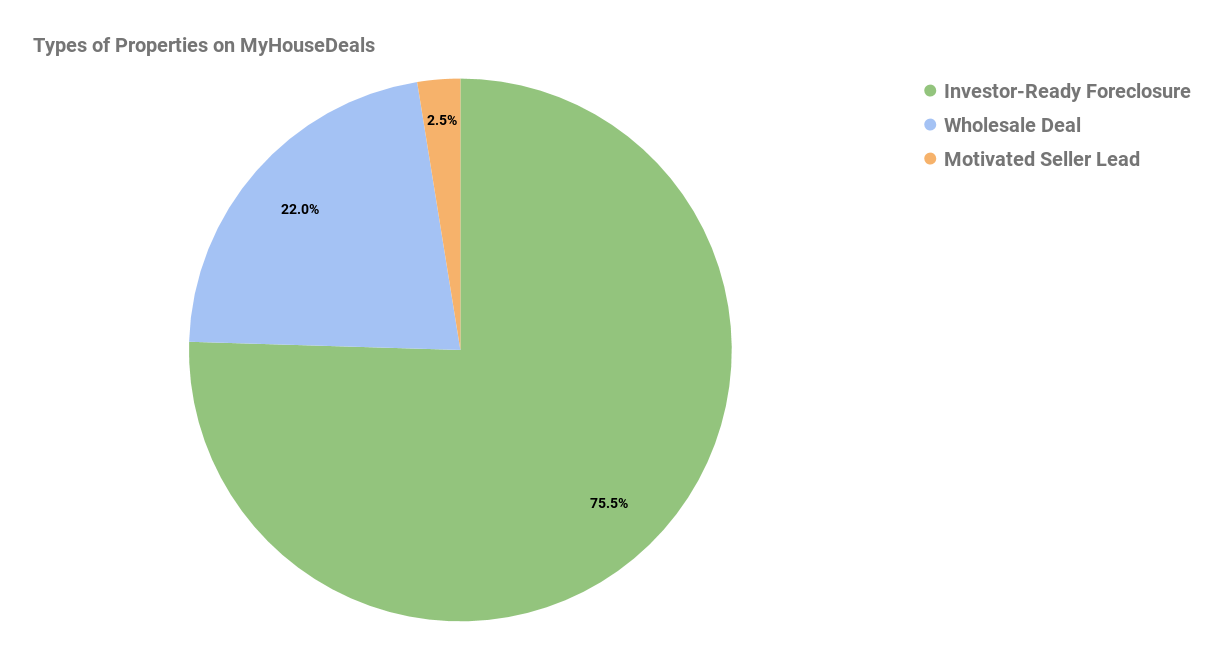
If you want to view a specific type of property deal, select only the property types you want to see in your search parameters.
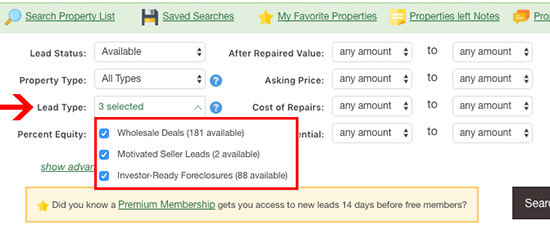
Click here for a detailed article about how to perform searches for properties on MyHouseDeals.
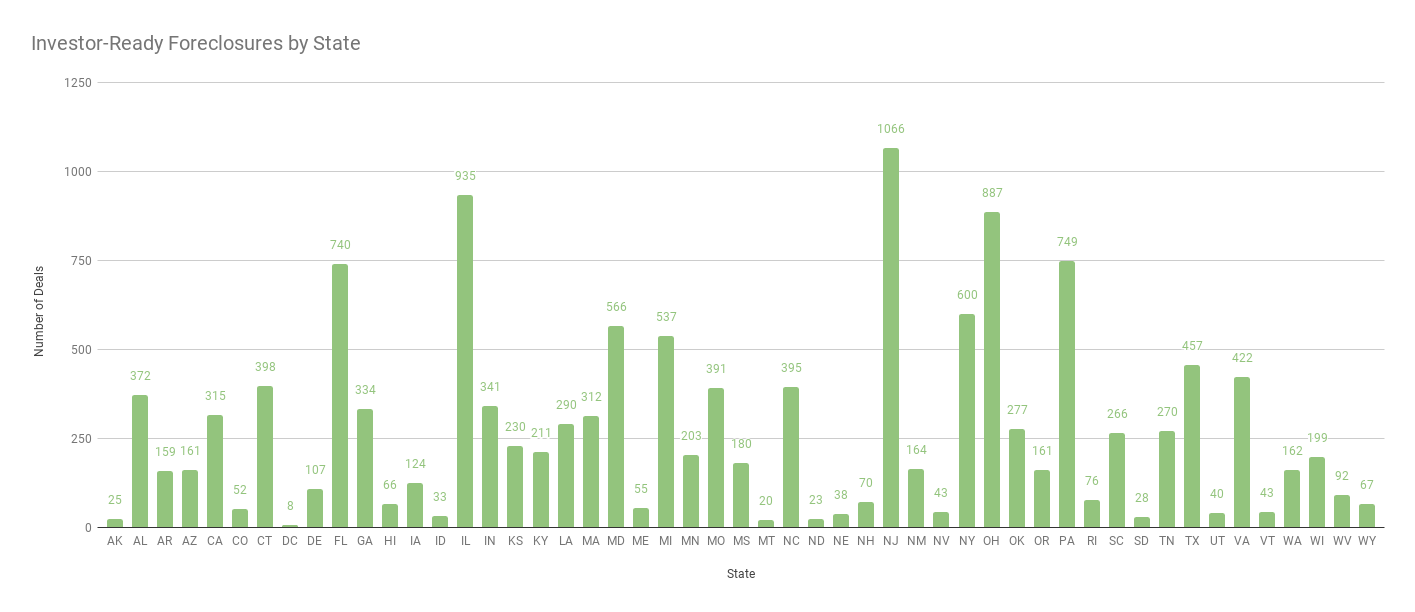
Last year we announced a new type of property deal: investor-ready foreclosures. To find out more about the new type of property, read this. Here’s a quick a re-cap:
Foreclosure auctions can be a waste of time, especially for new investors. That’s why we never bothered with offering foreclosures on our site. But…what about the properties that didn’t sell at auction? The banks want to sell these properties quickly in order to recoup their loss. We see huge opportunity in those properties. We call these deals investor-ready foreclosures.
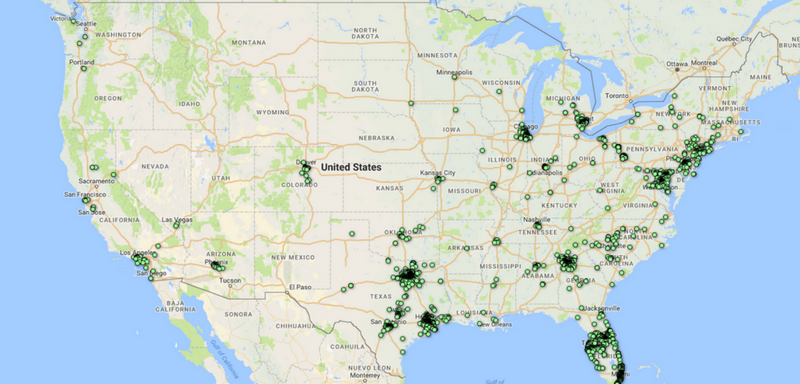
There are too many markets to list, so here is a breakdown of where these deals can be found by state. (Click image to expand.)
The top 5 market areas for wholesale property deals include:
- Houston
- DFW
- Washington DC
- Atlanta
- South Florida
Here are the exact number of deals per market area:
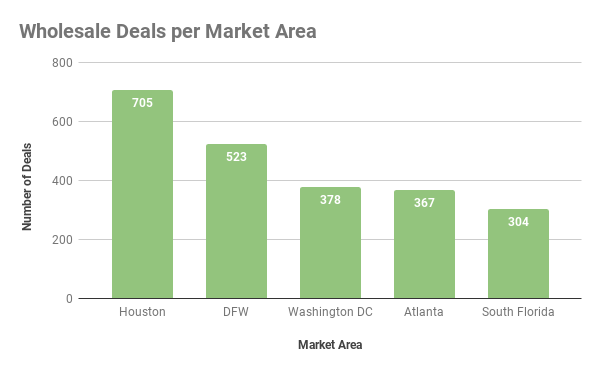
Wholesale Deal Activity per Market Area:
These maps are a little more interesting! You can see the HOT areas (and the not so hot areas) in each city. These are our top 25 markets (in order from the greatest amount of deals to least)!
Looking for a specific market? Click on the links below to jump directly to your area.
Atlanta
Bay Area
Beaumont & Port Arthur
Birmingham
Central Texas
Charlotte
Chicago
Cleveland
Denver
Detroit
Dallas/Fort-Worth
Houston
Indianapolis
Kansas City
Los Angeles
NYC/Tri-State Area
Oklahoma
Orlando/Daytona Beach/Melbourne
Philadelphia
Phoenix
Pittsburgh
Sherman, TX and Ada, OK
South Florida
Tampa Bay
Washington D.C.
#1 Houston
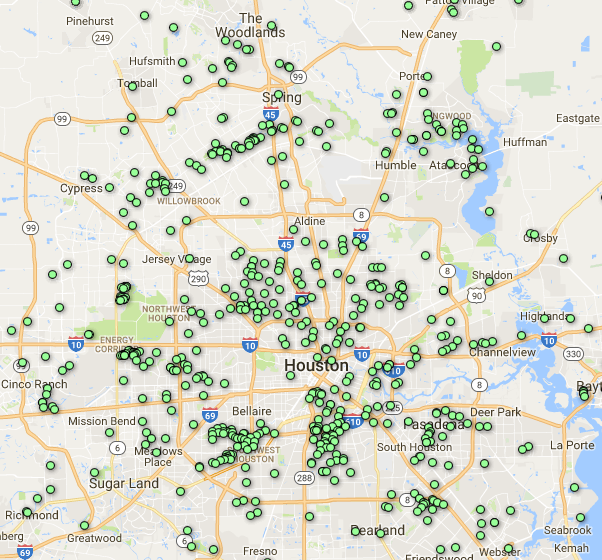
- 77084
- 77079
- 77385
- 77021
- 77096
#2 Dallas/Fort-Worth
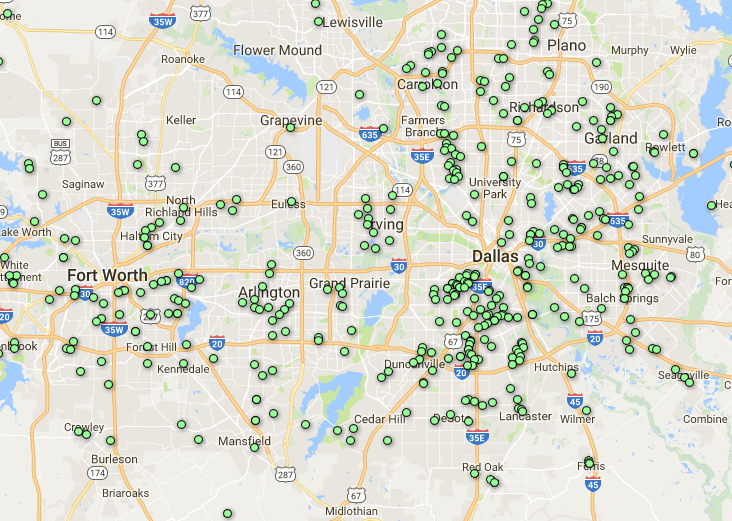
- 75216
- 75208
- 75232
- 75149
- 75241
#3 Washington, DC
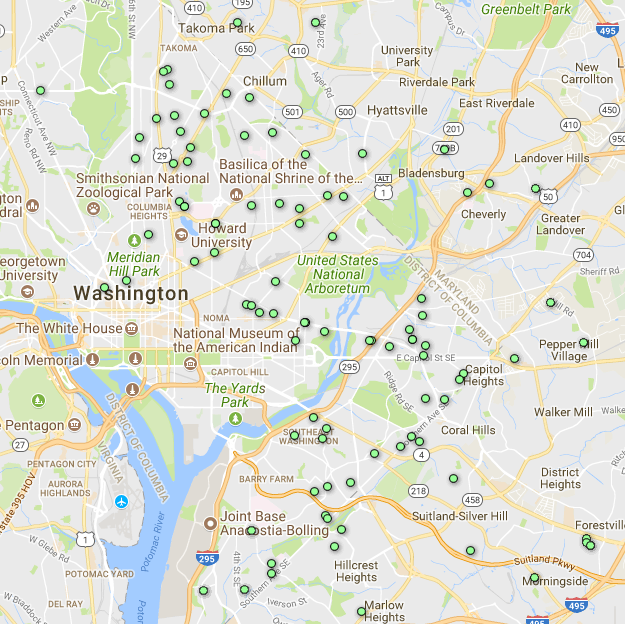
1. 21216
2. 20019
3. 21213
4. 20011
5. 20002
#4 Atlanta
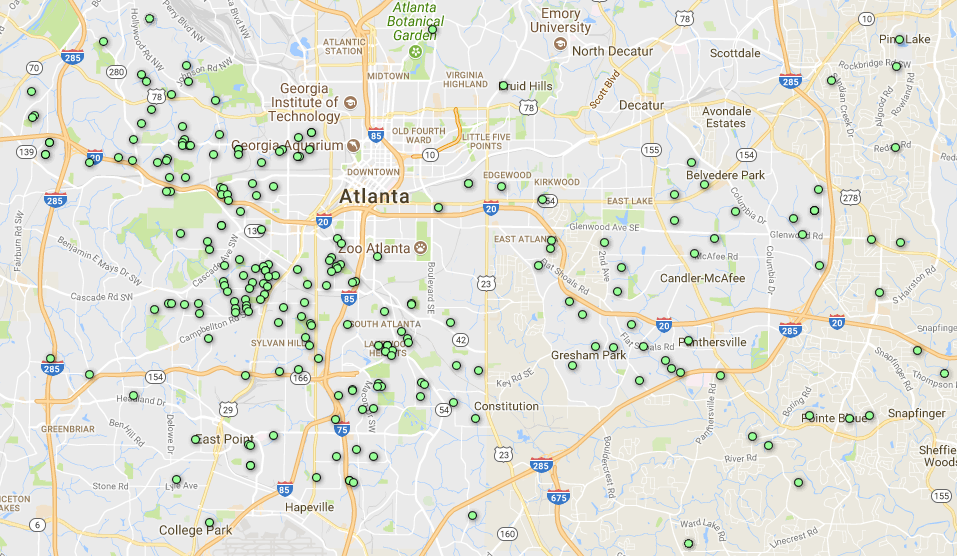
- 30310
- 30315
- 30314
- 30318
- 30331
#5 South Florida
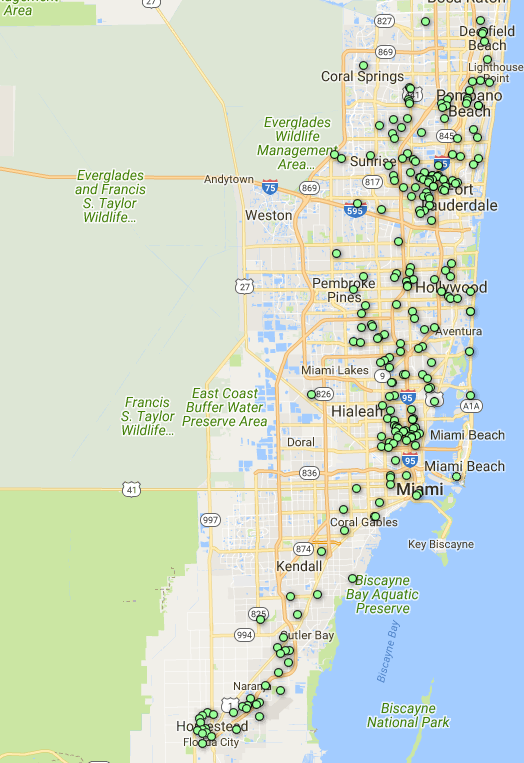
1. 33311
2. 33150
3. 33147
4. 33033
5. 33142
#6 Central Texas
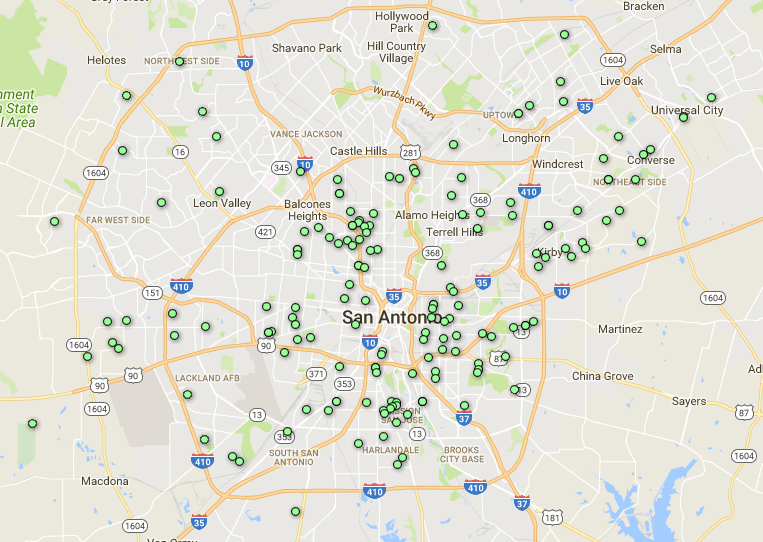
- 78201
- 78237
- 78214
- 78210
- 78220
#7 Orlando/Daytona Beach/Melbourne
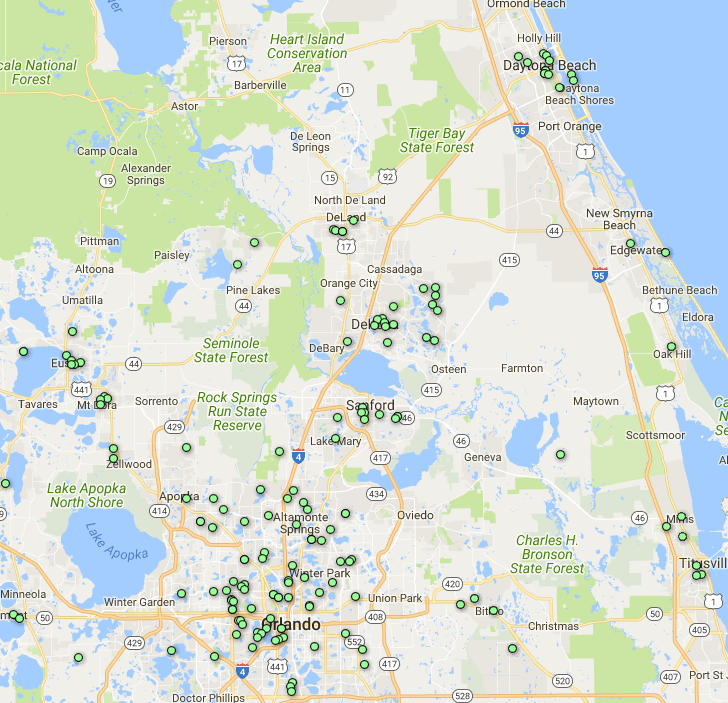
- 32808
- 32805
- 32114
- 32771
- 32725
#8 Tampa Bay
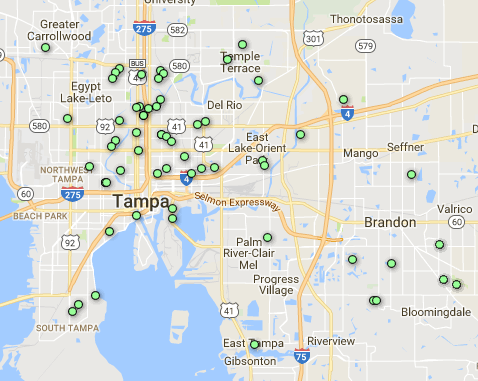
1. 33604
2. 33801
3. 33610
4. 33605
5. 33853
#9 Philadelphia
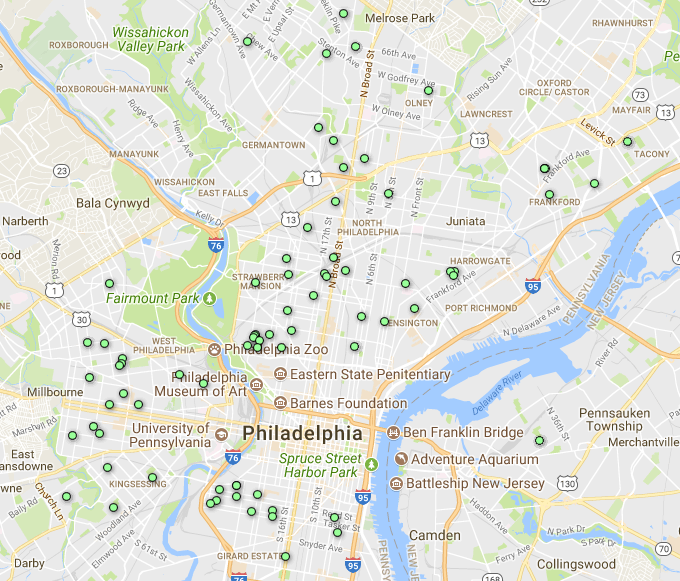
- 19121
- 19132
- 19146
- 19143
- 19140

#10 Detroit
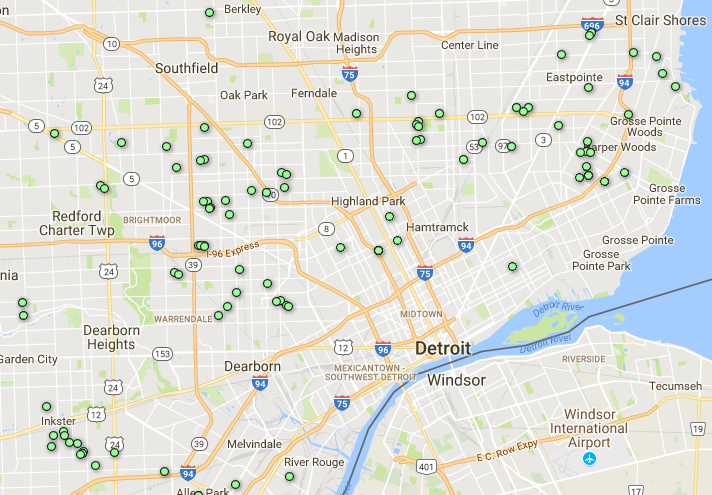
- 48227
- 48141
- 48234
- 48224
- 48235
#11 New York/Tri-State Area
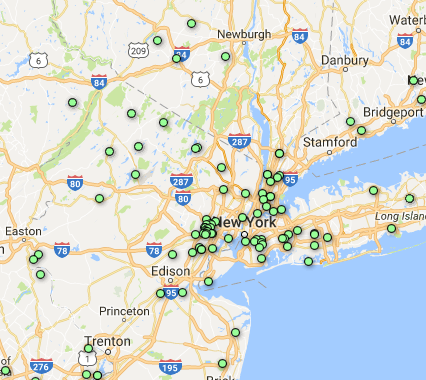
- 11103
- 10128
- 07203
- 07111
- 07103
#12 Chicago
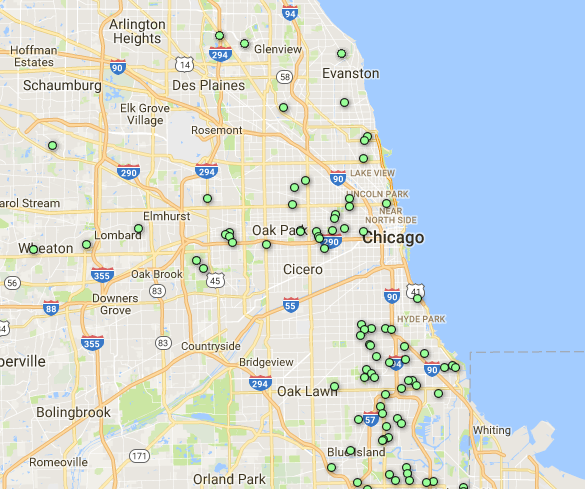
- 60636
- 60620
- 60619
- 60628
- 60624
#13 Pittsburgh
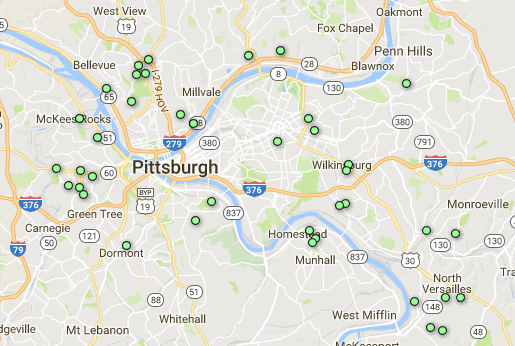
- 16101
- 16102
- 15205
- 16105
- 15214
#14 Los Angeles
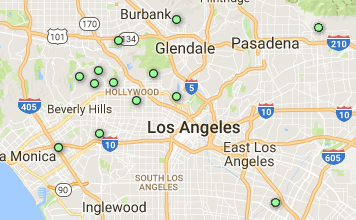
- 91709
- 92509
- 91356
- 90047
- 90046
#15 Phoenix
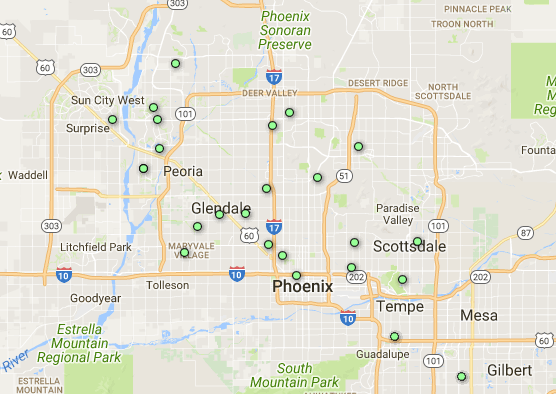
- 85351
- 85373
- 85301
- 85251
- 85023
#16 Indianapolis
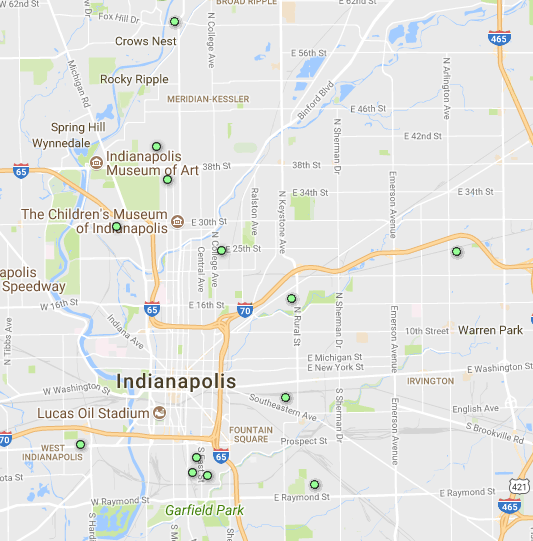
- 47362
- 46208
- 46225
- 46219
- 46203
#17 Beaumont & Port Arthur
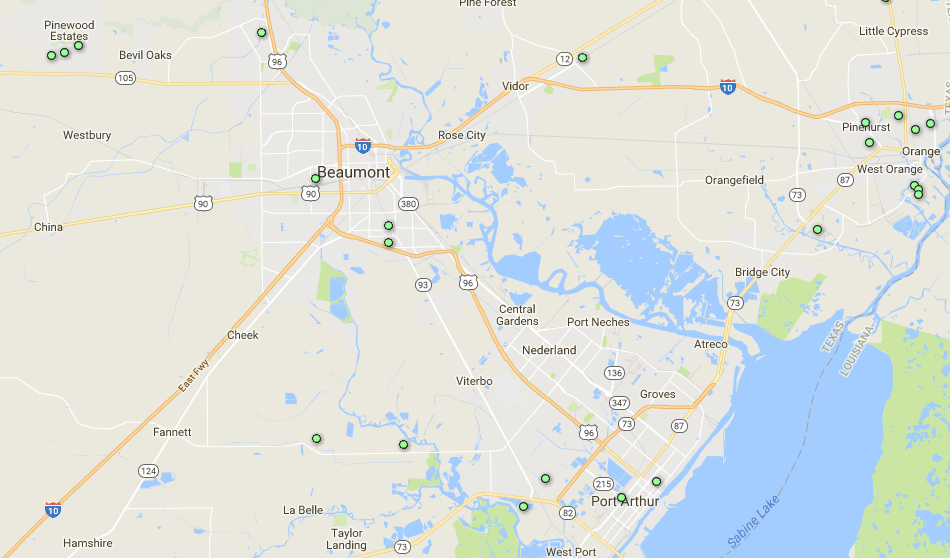
- 77630
- 77705
- 77659
- 77640
- 77662
#18 Birmingham
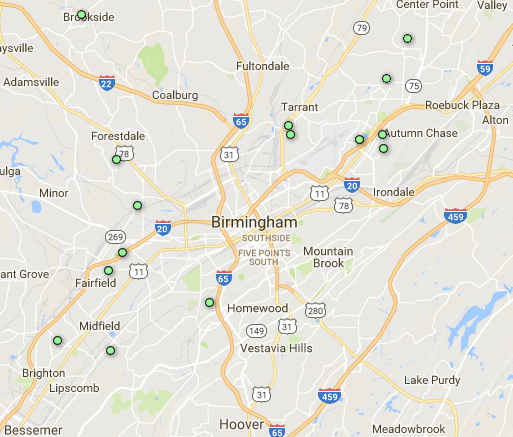
- 35206
- 35218
- 35217
- 35215
- 35214
#19 Charlotte
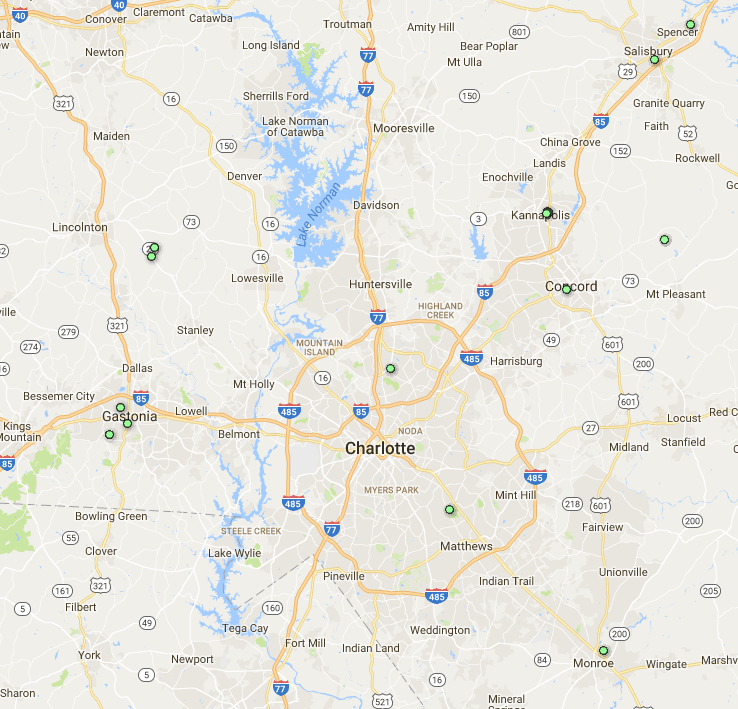
- 28083
- 28052
- 29706
- 28080
- 28025
#20 Denver
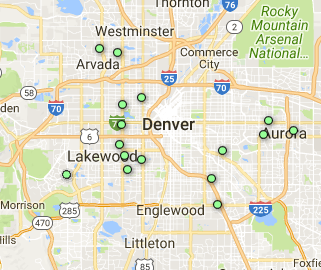
- 80219
- 80301
- 80222
- 80214
- 80010
#21 Oklahoma
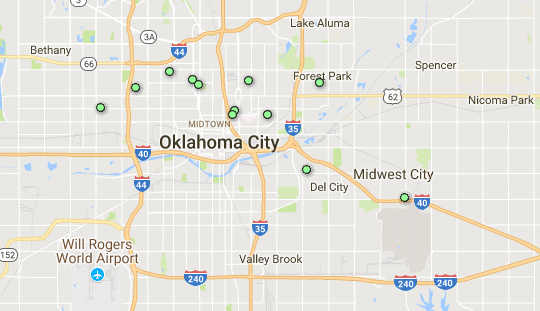
- 74804
- 73107
- 73104
- 74801
- 73121
#22 Kansas City
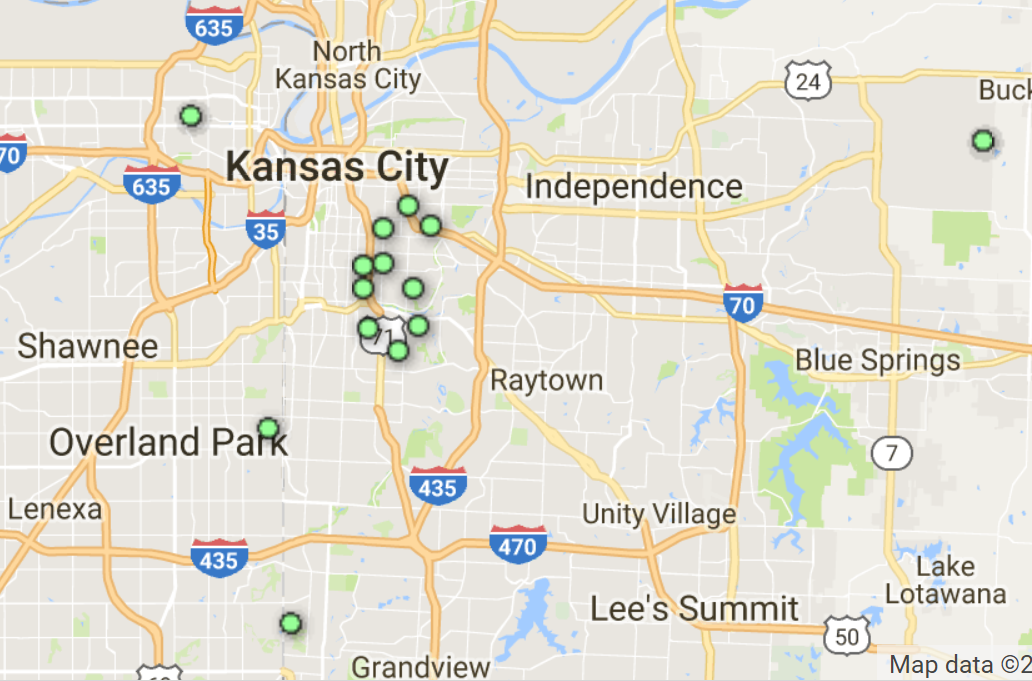
- 64130
- 64109
- 66208
- 66102
- 66064
#23 Sherman & Ada
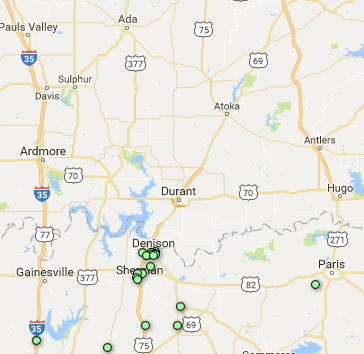
- 75020
- 75021
- 75092
- 75491
- 75090
#24 Bay Area
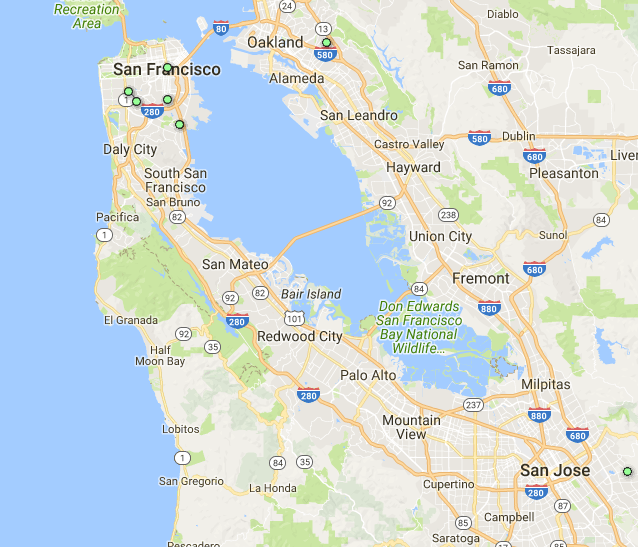
- 95120
- 94134
- 94131
- 94127
- 95461
#25 Cleveland
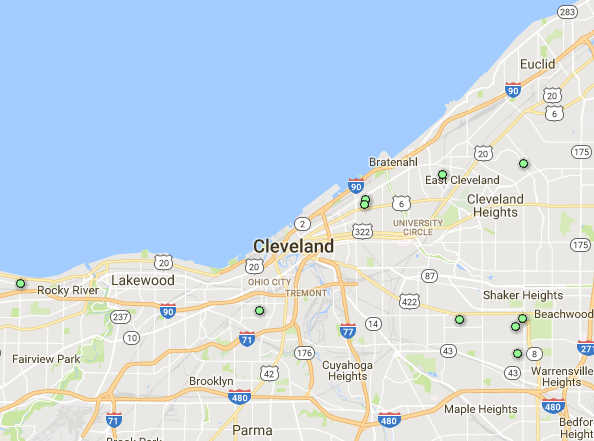
- 44312
- 44128
- 44122
- 44103
- 44708
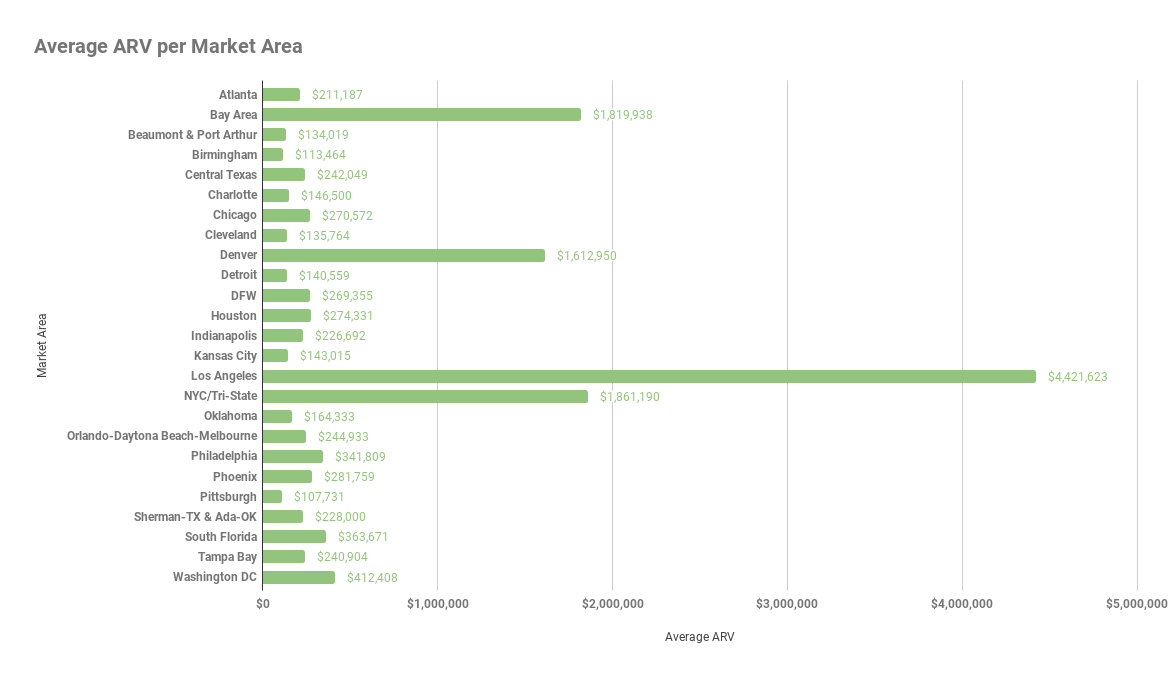
Average ARV per Market Area
Lastly, the average ARV for these 25 top market areas is summarized below:
Are you surprised by the zip codes on this list? Share your thoughts below…
To view a summarized report containing the top 5 zip codes for each market area, visit this page.