The numbers are out!
MyHouseDeals lists thousands of investment properties throughout the US. Since we have all of this property data available, we’re able to give you a summary of the hottest real estate investing markets right now.
Below we break out the three different deal types on our website: wholesale deals, investor-ready foreclosures and motivated seller deals. We then list the top states for foreclosure deals, so you can quickly determine which markets could have some low hanging fruit.
Then, we list the cities and zip codes with the greatest number of wholesale deals, followed by average ARV for each state. Check out the maps to see which areas are hot right now for bargain properties. To view the summarized report containing the top 5 zip codes for each market area, go here.
If you do your own marketing to find potential investment properties, target properties in these zip codes since they are more likely to have motivated sellers and/or properties needing repair. Both of these conditions can lead to greater discounts and profits for investors like you.


The Big Picture:
Here is a percentage breakdown of the types of properties we currently have on the site.


From the homepage you can search by any city, zip code or state. You will then be taken to a property results page listing houses in that market area with the ability to filter further by lead type and other house specifics, as shown below.


If you want to view a specific type of property deal, select only the property types you want to see in your search parameters. You can filter further under the “Advanced Options” tab.
Investor-Ready Foreclosures:
Foreclosure auctions can be a waste of time, especially for new investors. But…what about the properties that didn’t sell at auction? The banks want to sell these properties quickly in order to recoup their loss. We call these deals investor-ready foreclosures.
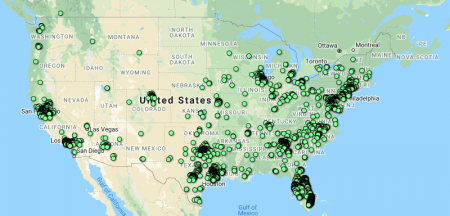
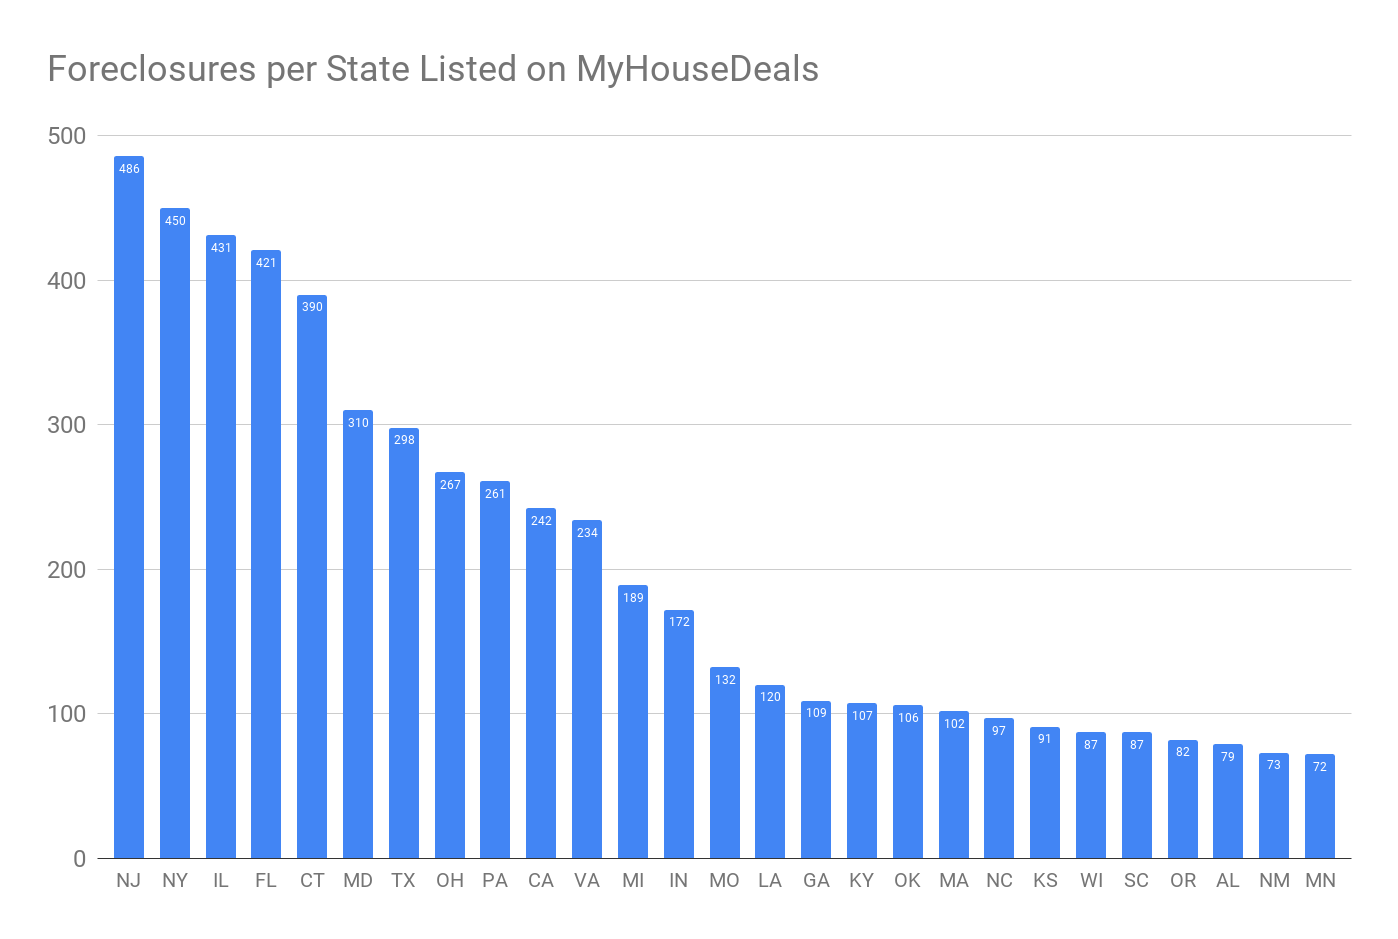
We have foreclosure listings in too many markets to list, so here is a breakdown of where these deals can be found by state. (Click image to expand.)

Wholesale Deals:
We are thrilled to release a list of the most popular zip codes for wholesale deals from October to December of 2019. We have compiled this data from thousands of wholesale deals that were posted to our website this past quarter.
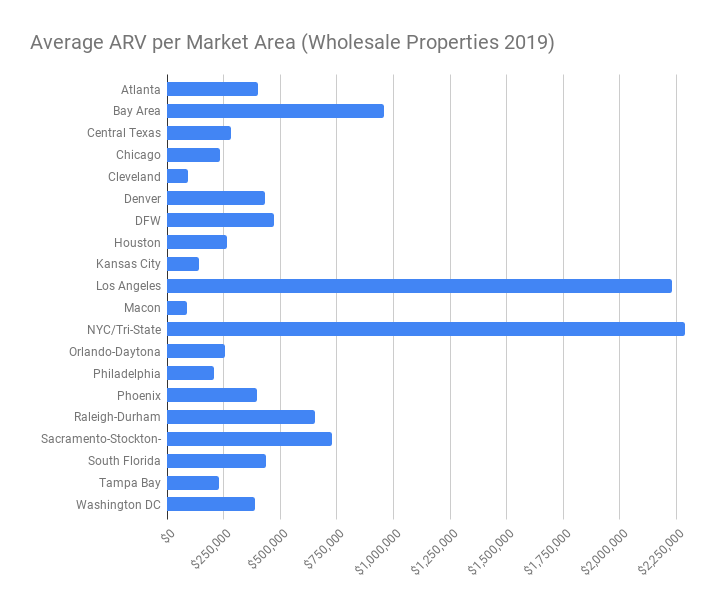
Keep reading for the breakdown of hot investment areas and the zip codes where we saw the highest levels of deals activity during this past quarter. Below that you’ll find a graph showing the average ARV for our wholesale properties in each state.
The top 5 market areas for wholesale property deals include:
- Houston
- DFW
- Washington DC
- Atlanta
- South Florida
Here is the exact number of deals per market area:
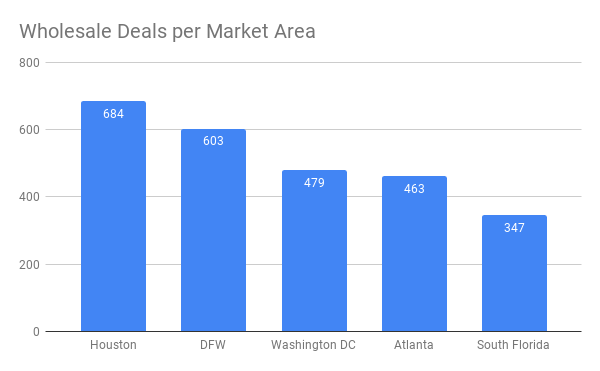
Wholesale Deal Activity per Market Area:
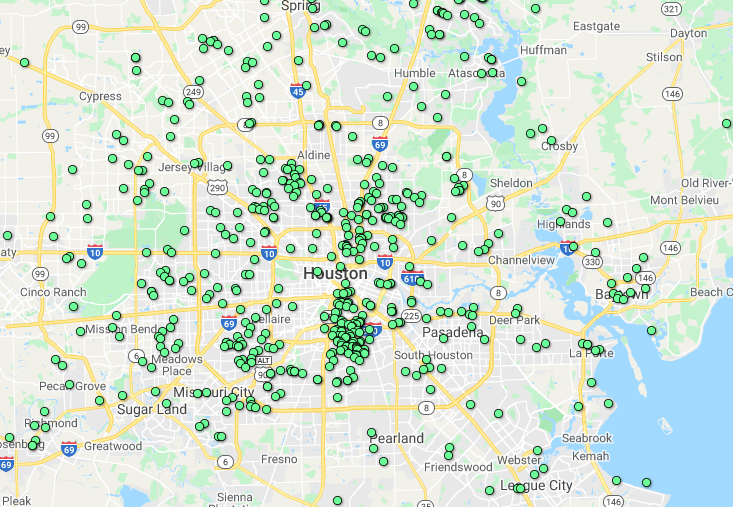
These maps are a little more interesting! You can see the HOT areas (and the not so hot areas) in each city. These are our top 20 markets (in order from the greatest amount of deals to least)!
Looking for a specific market? Click on the links below to jump directly to your area.
Houston
Dallas/Fort-Worth
Washington, DC
Atlanta
South Florida
Los Angeles
Orlando/Daytona Beach/Melbourne
Central Texas
Chicago
Tampa Bay
New York/Tri-State Area
Sacramento
Bay Area
Raleigh-Durham
Philadelphia
Denver
Cleveland
Macon
Phoenix
Kansas City
#1 Houston

- 77033
- 77021
- 77028
- 77339
- 77051
#2 Dallas/Fort-Worth
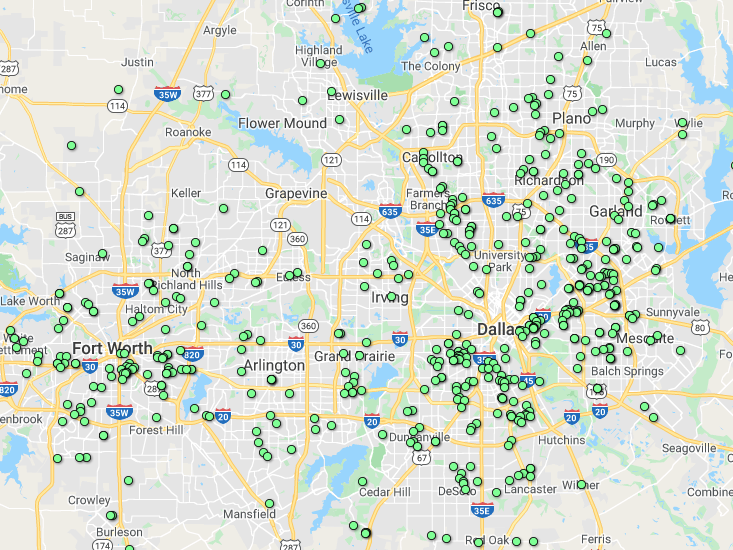

- 75228
- 75216
- 75227
- 75150
- 76104
#3 Washington, DC / Baltimore
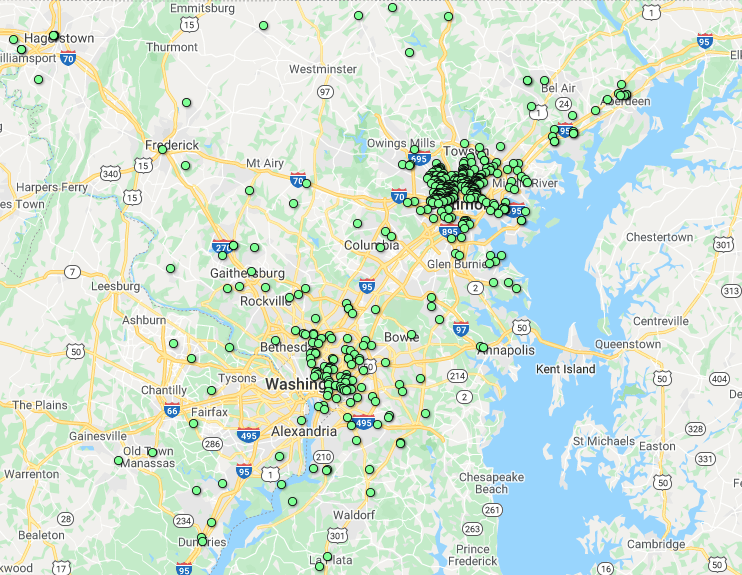

- 21213
- 21229
- 21217
- 21215
- 21223
#4 Atlanta
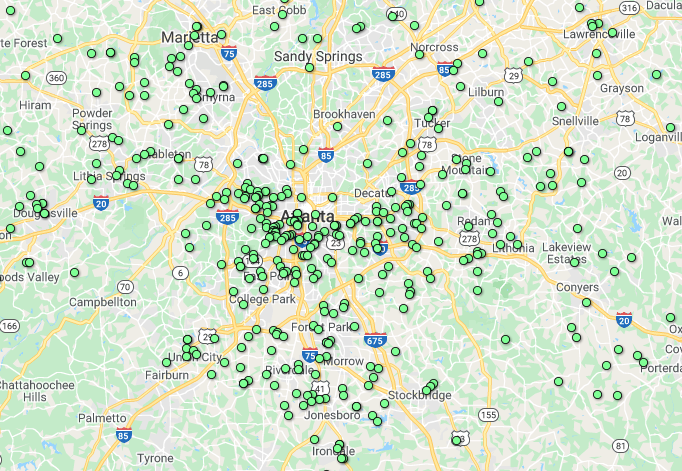

- 30310
- 30315
- 30318
- 30314
- 30032
#5 South Florida
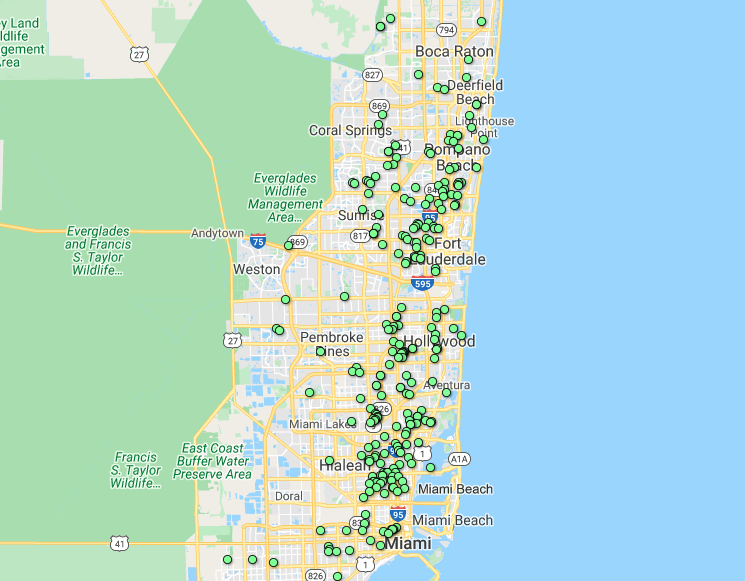

- 33311
- 33404
- 33147
- 33023
- 33161
#6 Los Angeles
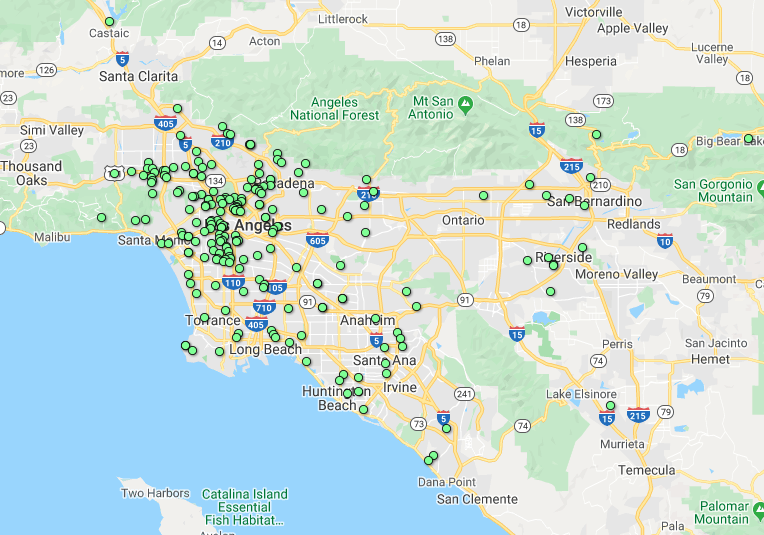

- 90026
- 90044
- 90042
- 91436
- 91403
#7 Orlando / Daytona Beach / Melbourne
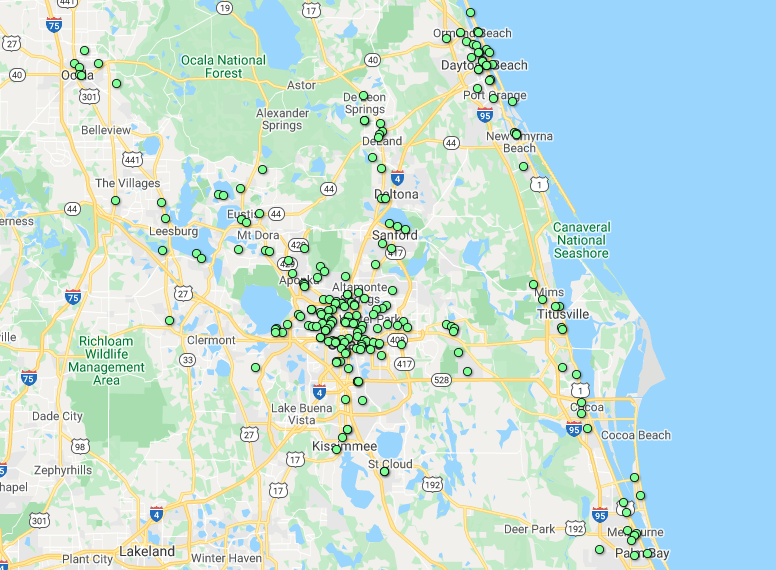

- 32808
- 32114
- 32810
- 34787
- 32818
#8 Central Texas
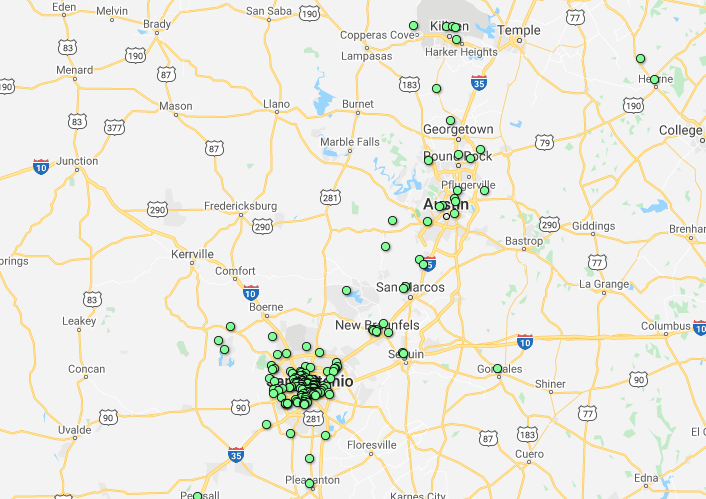

- 78210
- 78201
- 78221
- 78207
- 78202
#9 Chicago
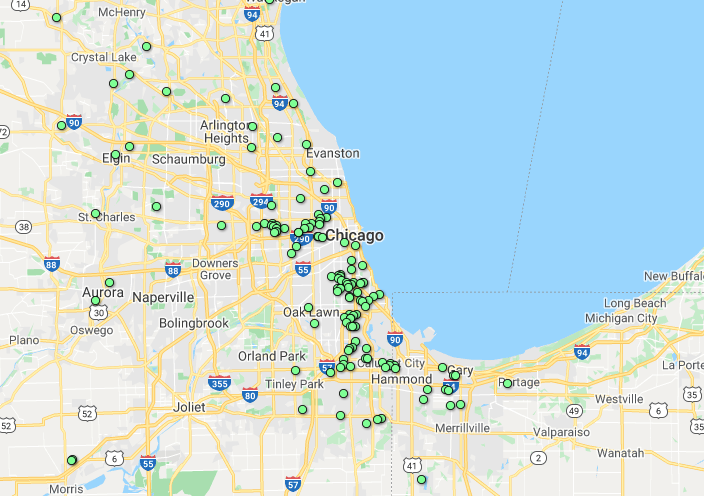

- 19121
- 19125
- 19131
- 19133
- 19143

#10 Tampa Bay / St. Petersburg
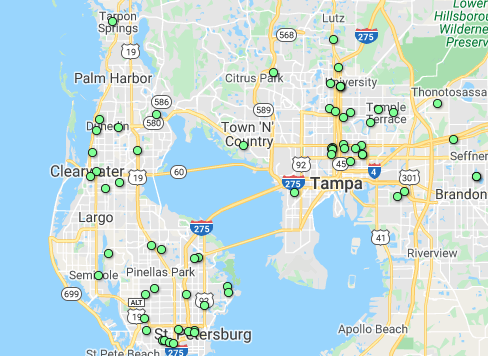

- 33603
- 33830
- 33815
- 33542
- 34668
#11 New York / Tri-State Area
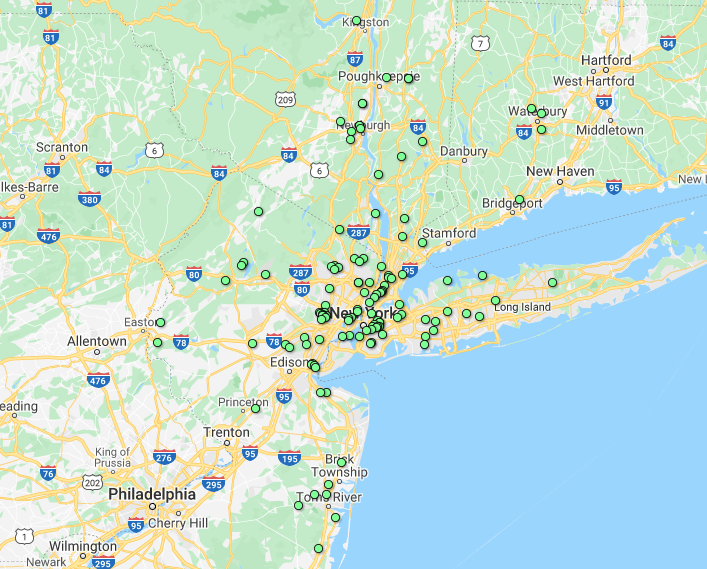

- 7017
- 7103
- 7106
- 7108
- 7111
#12 Sacramento/Stockton/Modesto
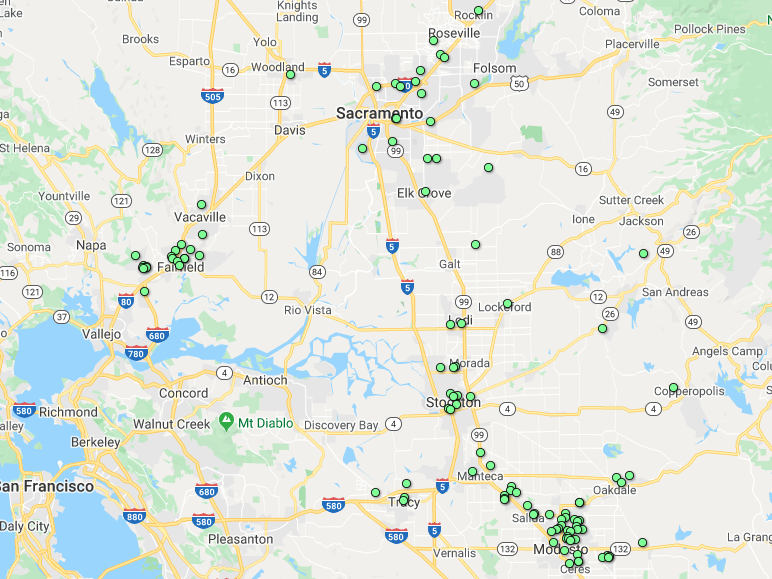

- 60409
- 60619
- 60620
- 60628
- 60636
#13 Bay Area
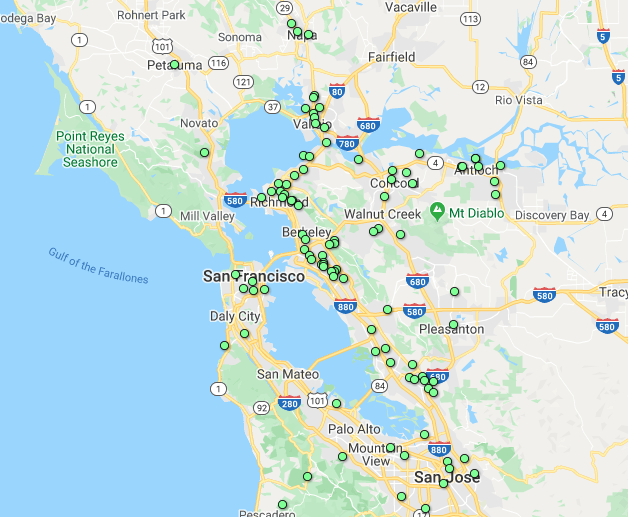

- 15132
- 15136
- 15203
- 15206
- 15221
#14 Raleigh / Durham
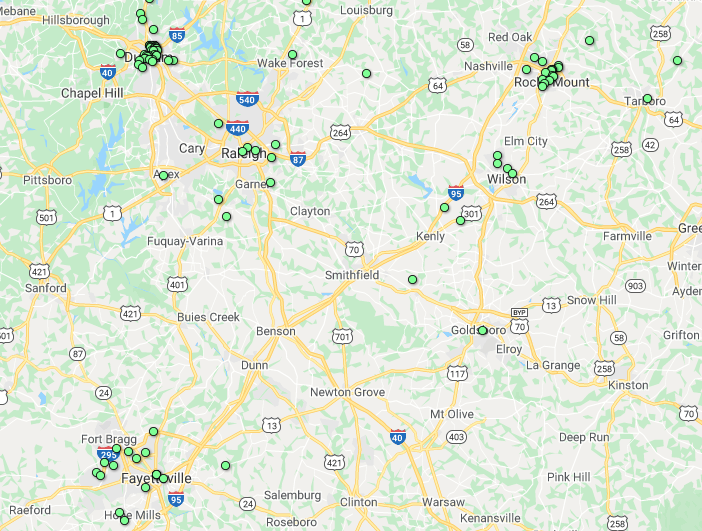

- 90042
- 90046
- 90065
- 92627
- 91403
#15 Philadelphia
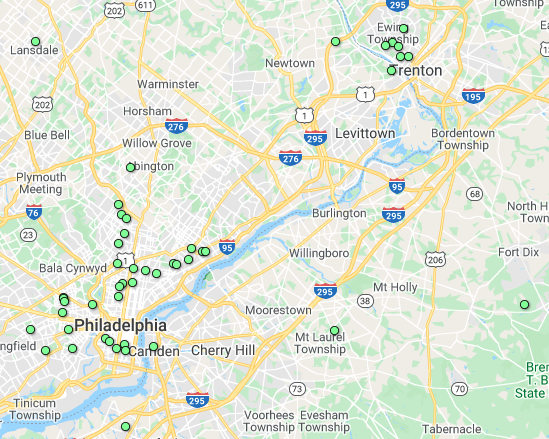

- 85033
- 85029
- 85017
- 85207
- 85303
#16 Denver
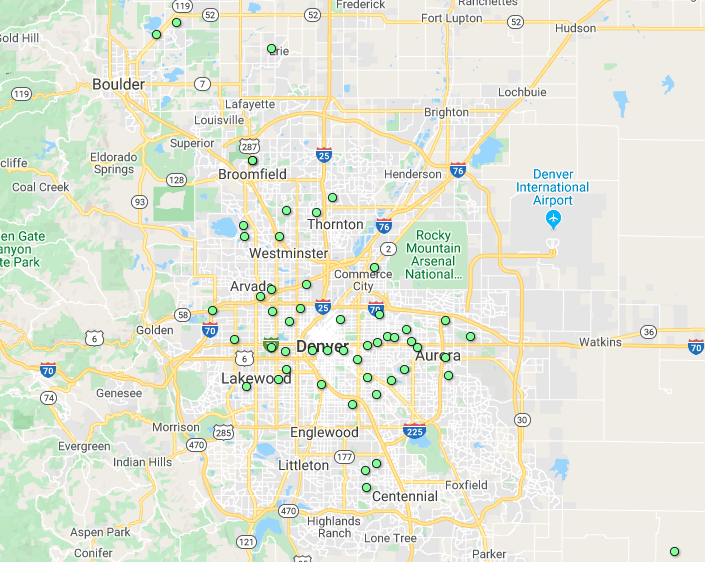

- 46201
- 46205
- 46208
- 46218
- 46222
#17 Cleveland
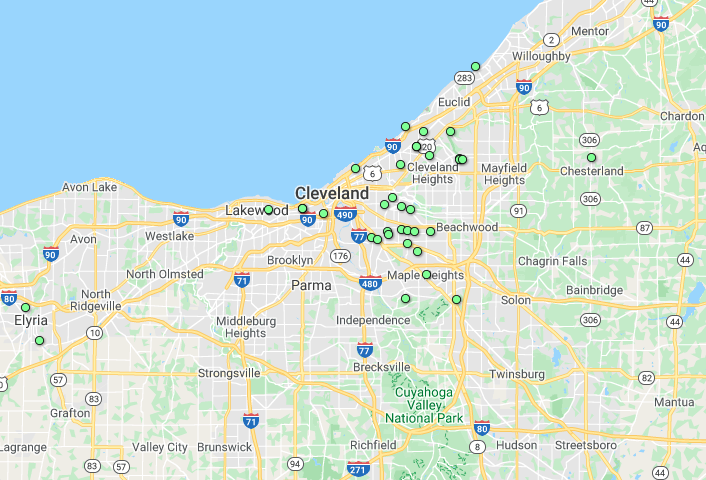

- 64128
- 64127
- 64130
- 66062
- 66104
#18 Macon
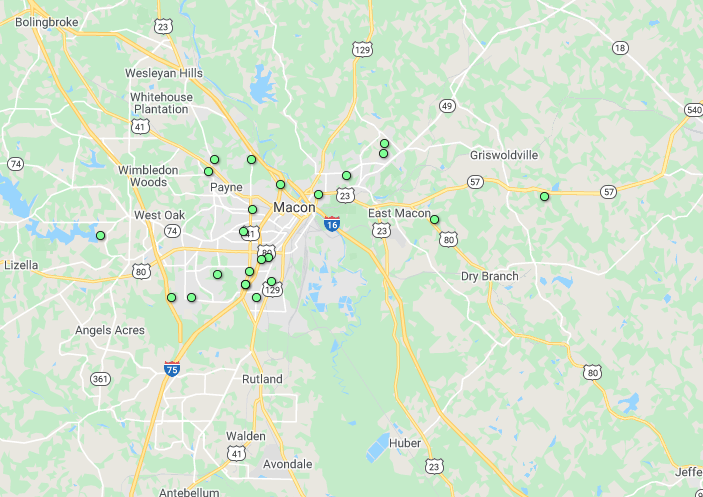

- 89044
- 89074
- 89081
- 89128
- 89129
#19 Phoenix

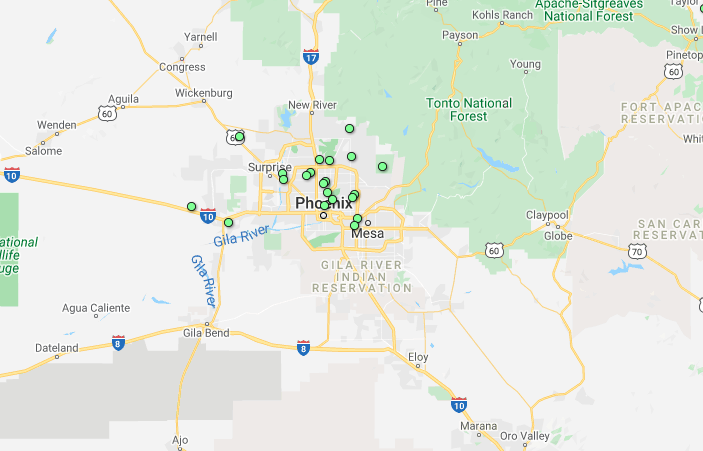
- 80010
- 80011
- 80012
- 80013
- 80247
#20 Kansas City
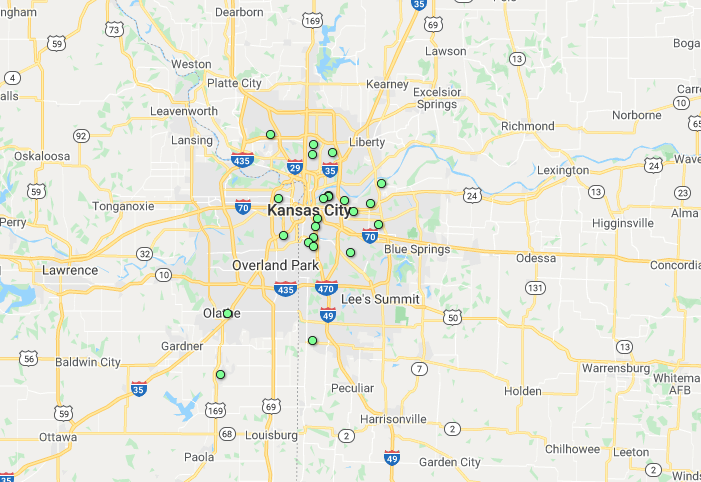

- 44102
- 44103
- 44107
- 44109
- 44113
Average ARV per Market Area
Lastly, the average ARV for these 20 top market areas is summarized below:

Are you surprised by the markets and zip codes on this list? Share your thoughts below…